

Answered step by step
Verified Expert Solution
Question
1 Approved Answer
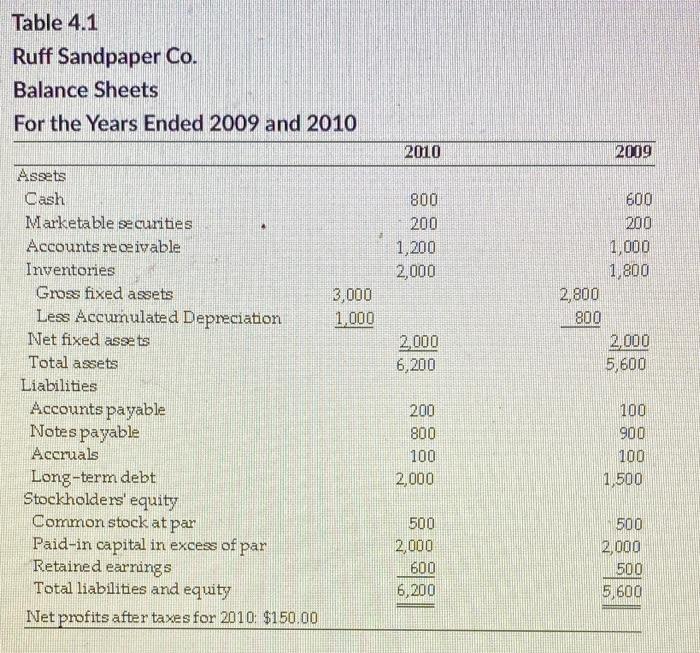
Table 4.1 Ruff Sandpaper Co. Balance Sheets For the Years Ended 2009 and 2010 2010 2009 800 200 1,200 2,000 600 200 1,000 1.800 2,800
Step by Step Solution
There are 3 Steps involved in it
Step: 1

Get Instant Access to Expert-Tailored Solutions
See step-by-step solutions with expert insights and AI powered tools for academic success
Step: 2

Step: 3
Ace Your Homework with AI
Get the answers you need in no time with our AI-driven, step-by-step assistance
Get Started
Computational Intelligence In Economics And Finance Volume II
Authors: Paul P. Wang, Tzu-Wen Kuo
2007th Edition
3540728201, 978-3540728207