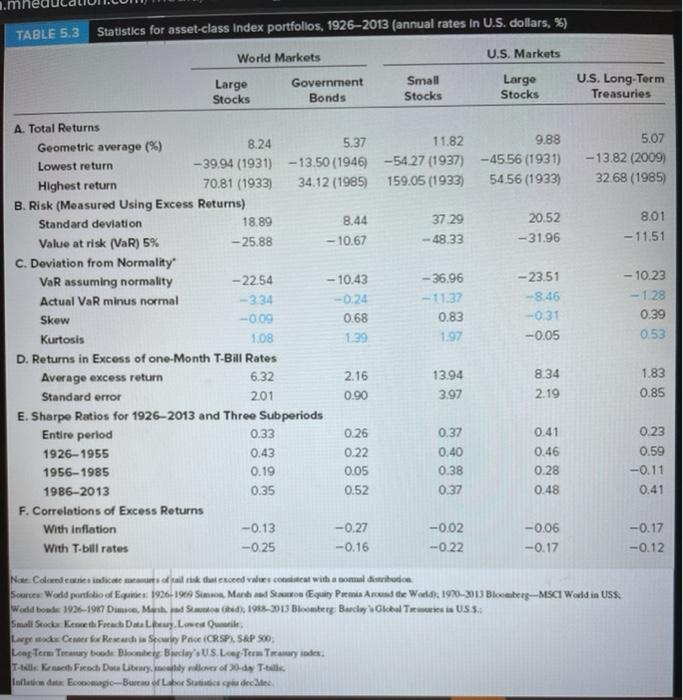
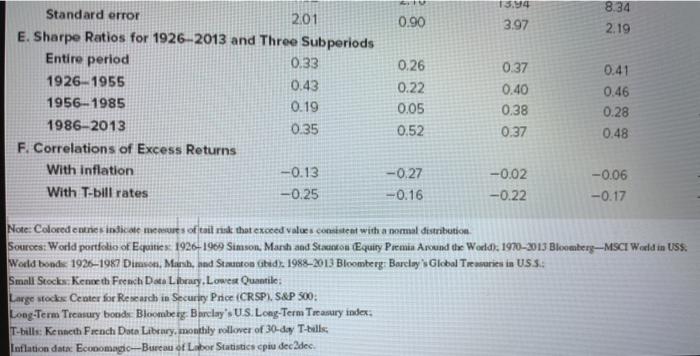
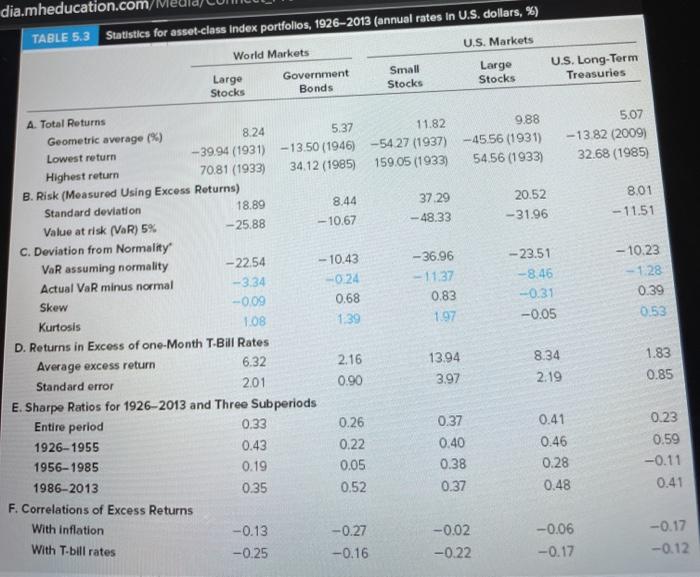
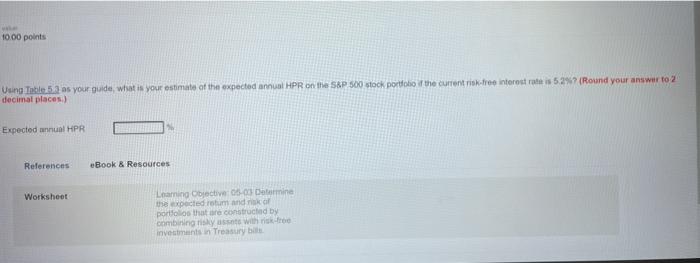
TABLE 5.3 Statistics for asset-class Index portfolios, 19262013 (annual rates in U.S. dollars. %) World Markets U.S. Markets Large Government Bonds Small Stocks Largo Stocks U.S. Long-Term Treasuries Stocks 5.07 -13.82 (2009) 32.68 (1985) 8.01 -11.51 A. Total Returns Geometric average (%) 8.24 5.37 11.82 9.88 Lowest return - 39.94 (1931) -13.50 (1946) -54.27 (1937) -4556 (1931) Highest return 70.81 (1933) 34.12 (1985) 159.05 (1933) 54.56 (1933) B. Risk (Measured Using Excess Returns) Standard deviation 18.89 8.44 37.29 20.52 Value at risk (VaR) 5% -25.88 -10.67 - 48.33 -31.96 C. Deviation from Normality VaR assuming normality -22.54 -10.43 - 36.96 -23.51 Actual VaR minus normal -334 -0.24 - 11:37 -8.46 Skew -0.09 0.68 0.83 -0.31 Kurtosis 1.08 139 1.97 -0.05 D. Returns in Excess of one-Month T-Bill Rates Average excess return 6.32 2.16 13.94 8.34 Standard error 201 0.90 3.97 2.19 E. Sharpe Ratios for 1926-2013 and Three Subperiods Entire period 0.33 0.26 0.37 0.41 1926-1955 0.43 0.22 0.40 0.46 1956-1985 0.19 0.05 0.38 0.28 1986-2013 0.35 0.52 0.37 0.48 F. Correlations of Excess Returns With inflation --0.13 -0.27 -0.02 -0.06 With T-bill rates -0.25 -0.16 -0.22 -0.17 - 10.23 -1.28 0.39 0.53 1.83 0.85 0.23 0.59 -0.11 0.41 -0.17 -0.12 Note: Coldweidicate of that exceed wales content with a sonnalibotice Source: Wodo pondo of E 1926-1949 Sime Manhado Equity Paenia Arund the Wedd: 1970-2013 Bloomberg-MSCI World in USS. Woeid bond 1926-1967 Dimice, Mark Seeds 1982-2013 Bloomberg Barclay Global Teries is US 5. Small Stade Renneth Face Data Lowe Le mode Center fowRewadia Swy Price CRSP. S&P 50 Long Term Tay boede Bloomberg Bay US.Leap Ter Tamarinder The Knect Ficoch Data Library.willover of 30 dy T-b. Inflation date. Eccomagic--Burn of Labor Statistics pudelee Using Table 5.3 as your guide, what is your estimate of the expected annual HPR on the S&P 500 stock portfolio of the current stro interest rate is 52 (Round your answer to 2 decimal places Expected annunt HPR 0.90 13.44 3.97 8.34 2.19 Standard error 2.01 E. Sharpe Ratios for 1926-2013 and Three Subperiods Entire period 0.33 1926 1955 0.43 1956-1985 0.19 1986-2013 0.35 F. Correlations of Excess Returns With inflation -0.13 With T-bill rates -0.25 0.26 0.22 0.05 0.52 0.41 0.46 0.37 0.40 0.38 0.37 0.28 0.48 -0.27 -0.16 -0.02 -0.22 -0.06 -0.17 Note: Colored coneindime mconures of tail risk that exceed values consistent with a normal distribution Sources: World portfolio of Equities: 1926-1969 Simson, Marsh and Station Equity Premia Around the World): 1970-2013 Bloomberg-MSCI World in USS. World bonds 19261987 Dimson, Marsh, and Stanton Gted. 1988-2013 Bloomberg: Barclays Global Treare in US5. Small Stocks, Kenneth French Data Library.Lowest Quantile Large stock Center for Research in Security Price CRSP. S&P 500 Long-Term Treasury boods Bloomberg: Borclay': U.S. Long-Term Treasury index. T-bills: Kenneth French Dato Library, monthly rollover of 30-day T-balls Inflation data: Economagic-Bureau of Labor Statistics cpu dec2dec. 10.00 points Using Table 52 as your guide, what is your estimate of the expected annual HPR on the S&P 500 stock portfoto the current risk-free interest rate is 52% (Round your answer to 2 decimal places.) Expected annual HPR References eBook & Resources Worksheet Learning Objective: Determine expected retumandako porttoos that are constructed by combining its with riske investments in Treasury be TABLE 5.3 Statistics for asset-class Index portfolios, 19262013 (annual rates in U.S. dollars. %) World Markets U.S. Markets Large Government Bonds Small Stocks Largo Stocks U.S. Long-Term Treasuries Stocks 5.07 -13.82 (2009) 32.68 (1985) 8.01 -11.51 A. Total Returns Geometric average (%) 8.24 5.37 11.82 9.88 Lowest return - 39.94 (1931) -13.50 (1946) -54.27 (1937) -4556 (1931) Highest return 70.81 (1933) 34.12 (1985) 159.05 (1933) 54.56 (1933) B. Risk (Measured Using Excess Returns) Standard deviation 18.89 8.44 37.29 20.52 Value at risk (VaR) 5% -25.88 -10.67 - 48.33 -31.96 C. Deviation from Normality VaR assuming normality -22.54 -10.43 - 36.96 -23.51 Actual VaR minus normal -334 -0.24 - 11:37 -8.46 Skew -0.09 0.68 0.83 -0.31 Kurtosis 1.08 139 1.97 -0.05 D. Returns in Excess of one-Month T-Bill Rates Average excess return 6.32 2.16 13.94 8.34 Standard error 201 0.90 3.97 2.19 E. Sharpe Ratios for 1926-2013 and Three Subperiods Entire period 0.33 0.26 0.37 0.41 1926-1955 0.43 0.22 0.40 0.46 1956-1985 0.19 0.05 0.38 0.28 1986-2013 0.35 0.52 0.37 0.48 F. Correlations of Excess Returns With inflation --0.13 -0.27 -0.02 -0.06 With T-bill rates -0.25 -0.16 -0.22 -0.17 - 10.23 -1.28 0.39 0.53 1.83 0.85 0.23 0.59 -0.11 0.41 -0.17 -0.12 Note: Coldweidicate of that exceed wales content with a sonnalibotice Source: Wodo pondo of E 1926-1949 Sime Manhado Equity Paenia Arund the Wedd: 1970-2013 Bloomberg-MSCI World in USS. Woeid bond 1926-1967 Dimice, Mark Seeds 1982-2013 Bloomberg Barclay Global Teries is US 5. Small Stade Renneth Face Data Lowe Le mode Center fowRewadia Swy Price CRSP. S&P 50 Long Term Tay boede Bloomberg Bay US.Leap Ter Tamarinder The Knect Ficoch Data Library.willover of 30 dy T-b. Inflation date. Eccomagic--Burn of Labor Statistics pudelee Using Table 5.3 as your guide, what is your estimate of the expected annual HPR on the S&P 500 stock portfolio of the current stro interest rate is 52 (Round your answer to 2 decimal places Expected annunt HPR 0.90 13.44 3.97 8.34 2.19 Standard error 2.01 E. Sharpe Ratios for 1926-2013 and Three Subperiods Entire period 0.33 1926 1955 0.43 1956-1985 0.19 1986-2013 0.35 F. Correlations of Excess Returns With inflation -0.13 With T-bill rates -0.25 0.26 0.22 0.05 0.52 0.41 0.46 0.37 0.40 0.38 0.37 0.28 0.48 -0.27 -0.16 -0.02 -0.22 -0.06 -0.17 Note: Colored coneindime mconures of tail risk that exceed values consistent with a normal distribution Sources: World portfolio of Equities: 1926-1969 Simson, Marsh and Station Equity Premia Around the World): 1970-2013 Bloomberg-MSCI World in USS. World bonds 19261987 Dimson, Marsh, and Stanton Gted. 1988-2013 Bloomberg: Barclays Global Treare in US5. Small Stocks, Kenneth French Data Library.Lowest Quantile Large stock Center for Research in Security Price CRSP. S&P 500 Long-Term Treasury boods Bloomberg: Borclay': U.S. Long-Term Treasury index. T-bills: Kenneth French Dato Library, monthly rollover of 30-day T-balls Inflation data: Economagic-Bureau of Labor Statistics cpu dec2dec. 10.00 points Using Table 52 as your guide, what is your estimate of the expected annual HPR on the S&P 500 stock portfoto the current risk-free interest rate is 52% (Round your answer to 2 decimal places.) Expected annual HPR References eBook & Resources Worksheet Learning Objective: Determine expected retumandako porttoos that are constructed by combining its with riske investments in Treasury be
