

Question
Table 5-3 The following table shows the demand schedule for a particular good. table[[Price,Quantity],[ $15 ,0],[ $12 ,5],[ $9 ,10],[ $6 ,15],[ $3 ,20],[ $0
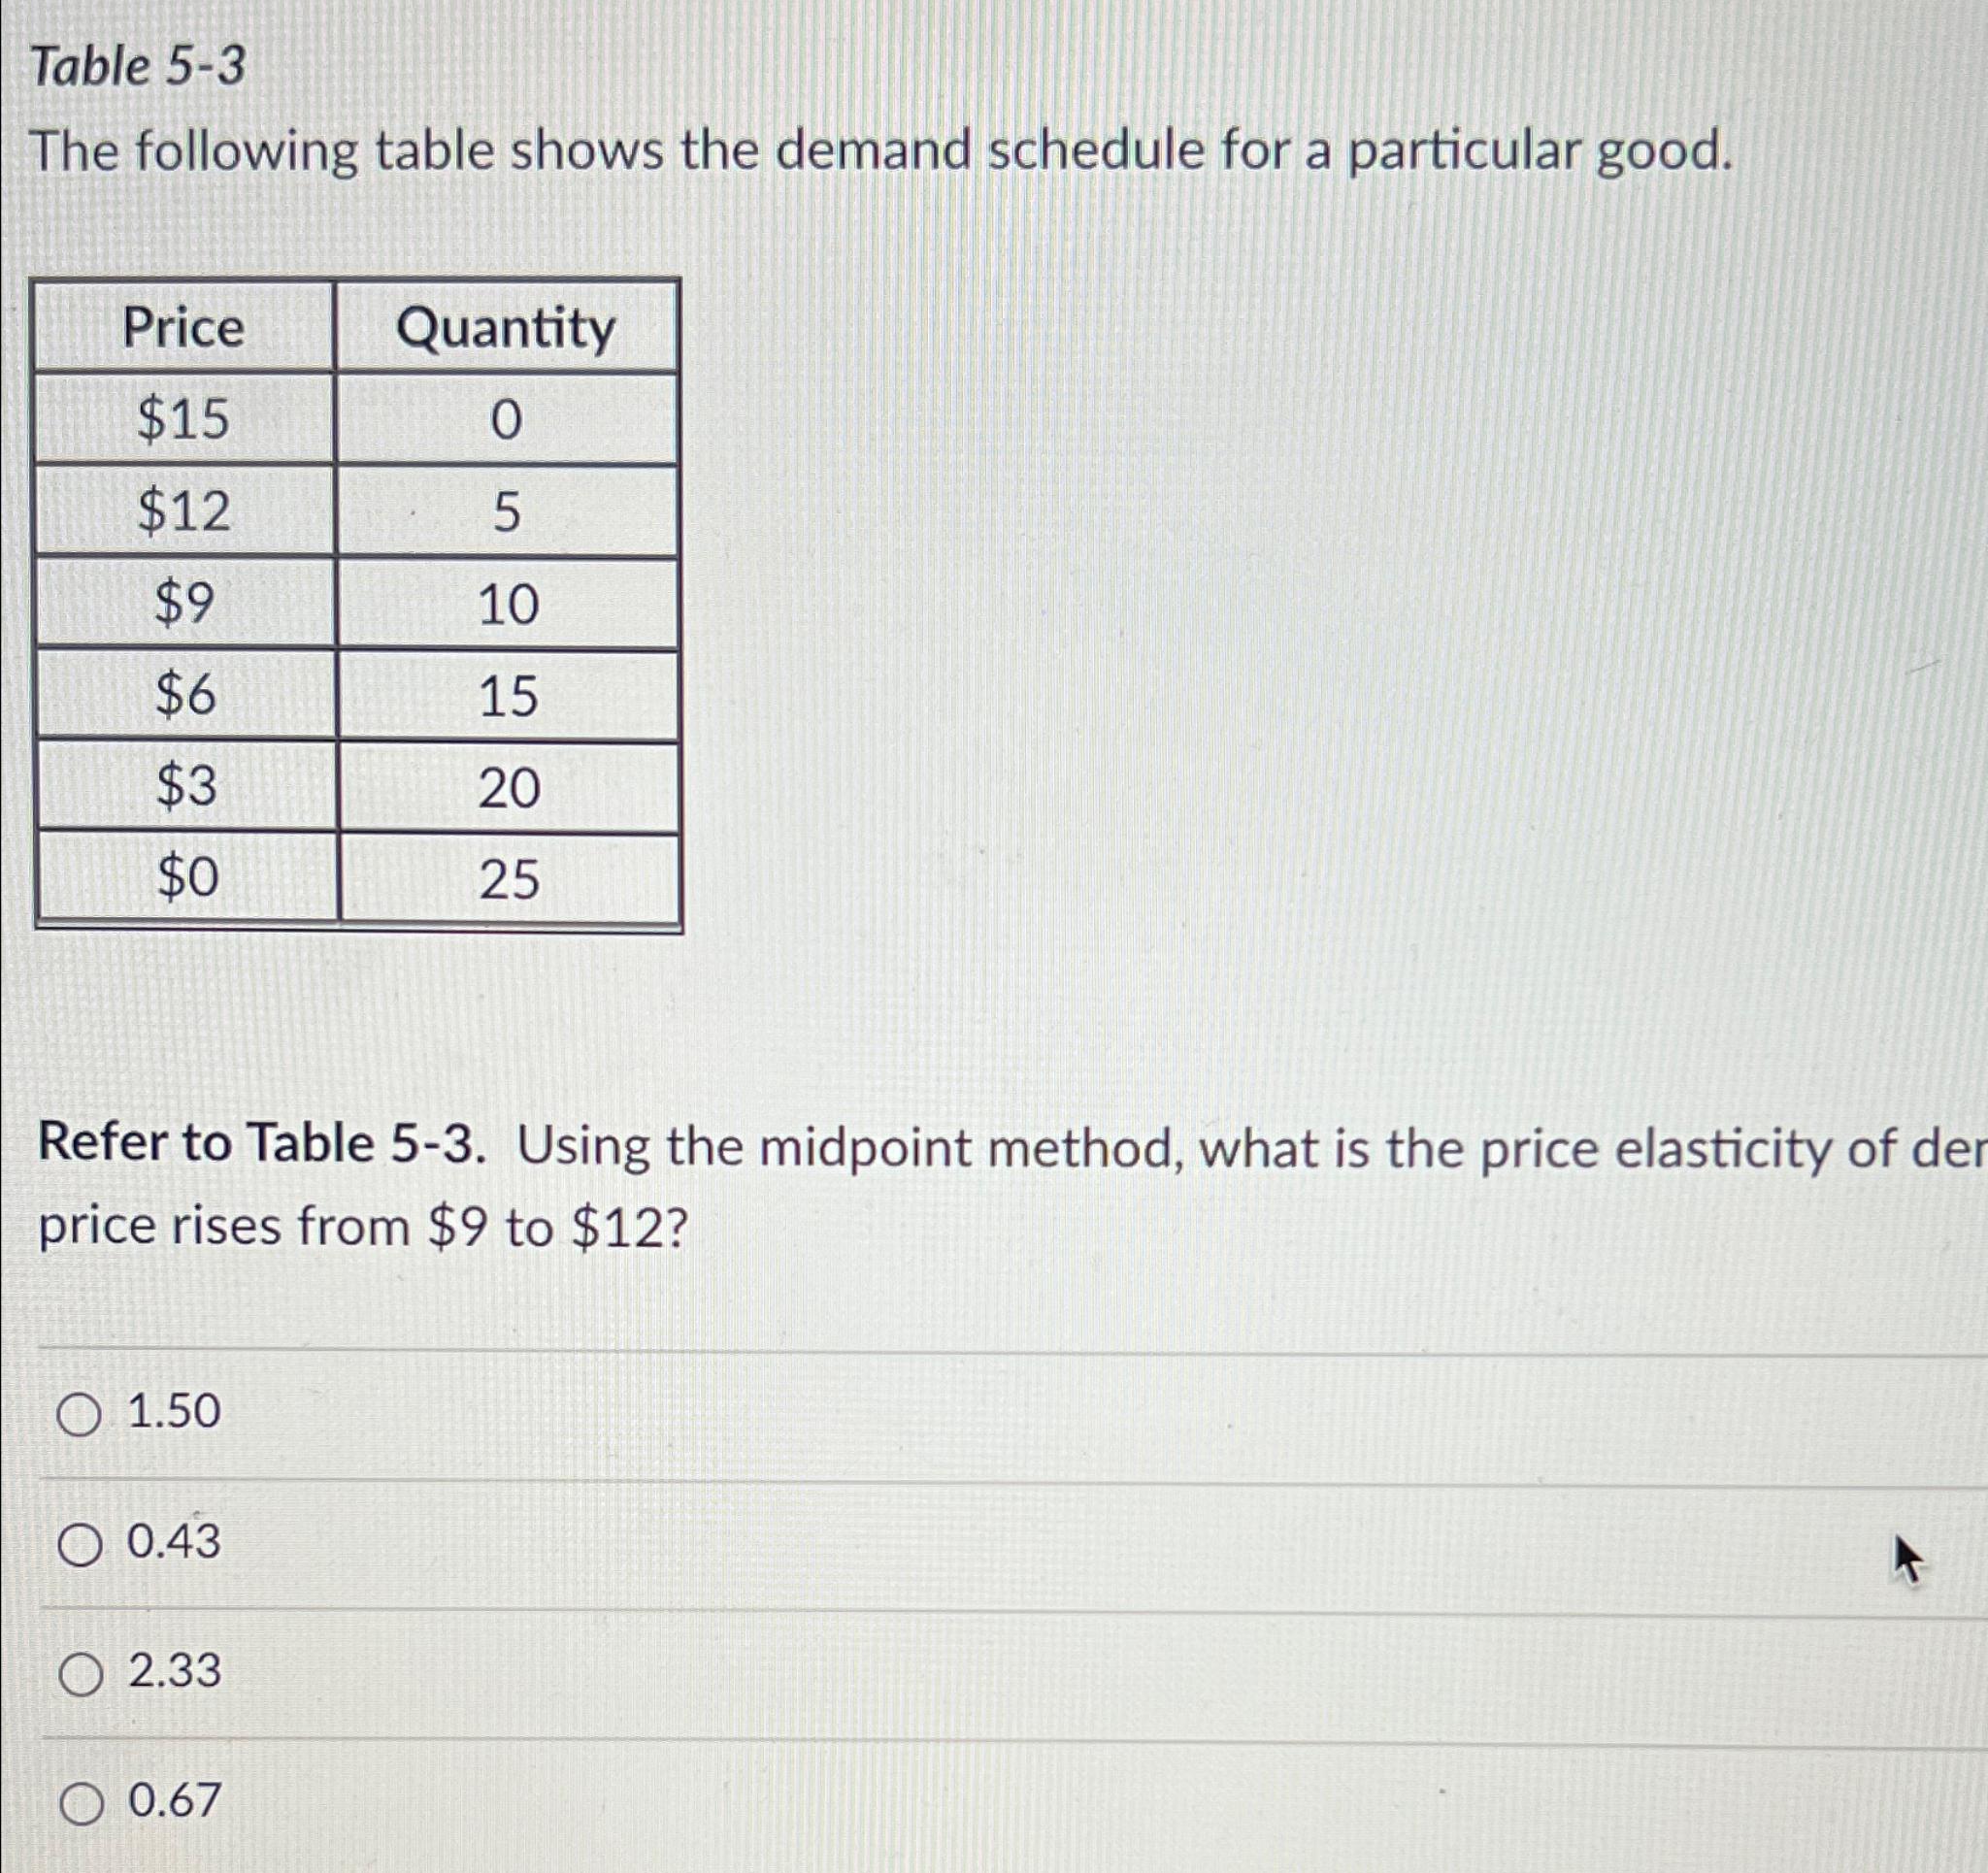
Table 5-3\ The following table shows the demand schedule for a particular good.\ \\\\table[[Price,Quantity],[
$15,0],[
$12,5],[
$9,10],[
$6,15],[
$3,20],[
$0,25]]\ Refer to Table 5-3. Using the midpoint method, what is the price elasticity of der price rises from
$9to
$12?\ 1.50\ 0.43\ 2.33\ 0.67
Step by Step Solution
There are 3 Steps involved in it
Step: 1

Get Instant Access to Expert-Tailored Solutions
See step-by-step solutions with expert insights and AI powered tools for academic success
Step: 2

Step: 3
Ace Your Homework with AI
Get the answers you need in no time with our AI-driven, step-by-step assistance
Get Started
XML Data Management Native XML And XML Enabled Database Systems
Authors: Akmal Chaudhri, Awais Rashid, Roberto Zicari, John Fuller
1st Edition
0201844524, 978-0201844528