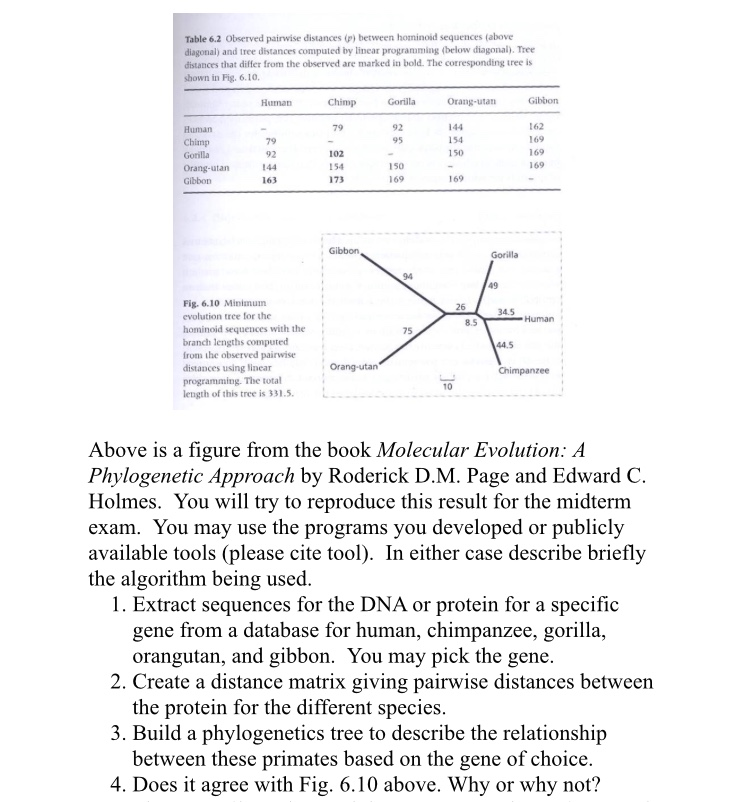
Table 6.2 Observed pairwise distances (p) between hominoid sequences (above diagonal) and tree distances computed by linear programming (below diagonal). Tree distances that differ from the observed are marked in bold. The corresponding tree is shown in Fig. 6.10. Human Chimp GorillaO Orang-utan 144 154 150 162 169 169 169 92 95 79 79 92 144 163 102 154 173 150 169 Orang-utan 169 Gibbon Fig. 6.10 Minimum evolution trce for the hominojd sequences with the branch lengths computed from the observed pairwise distances using linear programming. The total length of this tree is 331.5 26 34.5 Human 8.5 75 4.5 Orang-utan 10 Above is a figure from the book Molecular Evolution: A Phylogenetic Approach by Roderick D.M. Page and Edward C. Holmes. You will try to reproduce this result for the midternm exam. You may use the programs you developed or publicly available tools (please cite tool). In either case describe briefly the algorithm being used 1. Extract sequences for the DNA or protein for a specific gene from a database for human, chimpanzee, gorilla, orangutan, and gibbon. You may pick the gene. 2. Create a distance matrix giving pairwise distances betweein the protein for the different species 3. Build a phylogenetics tree to describe the relationship between these primates based on the gene of choice. 4. Does it agree with Fig. 6.10 above. Why or why not? Table 6.2 Observed pairwise distances (p) between hominoid sequences (above diagonal) and tree distances computed by linear programming (below diagonal). Tree distances that differ from the observed are marked in bold. The corresponding tree is shown in Fig. 6.10. Human Chimp GorillaO Orang-utan 144 154 150 162 169 169 169 92 95 79 79 92 144 163 102 154 173 150 169 Orang-utan 169 Gibbon Fig. 6.10 Minimum evolution trce for the hominojd sequences with the branch lengths computed from the observed pairwise distances using linear programming. The total length of this tree is 331.5 26 34.5 Human 8.5 75 4.5 Orang-utan 10 Above is a figure from the book Molecular Evolution: A Phylogenetic Approach by Roderick D.M. Page and Edward C. Holmes. You will try to reproduce this result for the midternm exam. You may use the programs you developed or publicly available tools (please cite tool). In either case describe briefly the algorithm being used 1. Extract sequences for the DNA or protein for a specific gene from a database for human, chimpanzee, gorilla, orangutan, and gibbon. You may pick the gene. 2. Create a distance matrix giving pairwise distances betweein the protein for the different species 3. Build a phylogenetics tree to describe the relationship between these primates based on the gene of choice. 4. Does it agree with Fig. 6.10 above. Why or why not