

Answered step by step
Verified Expert Solution
Question
1 Approved Answer
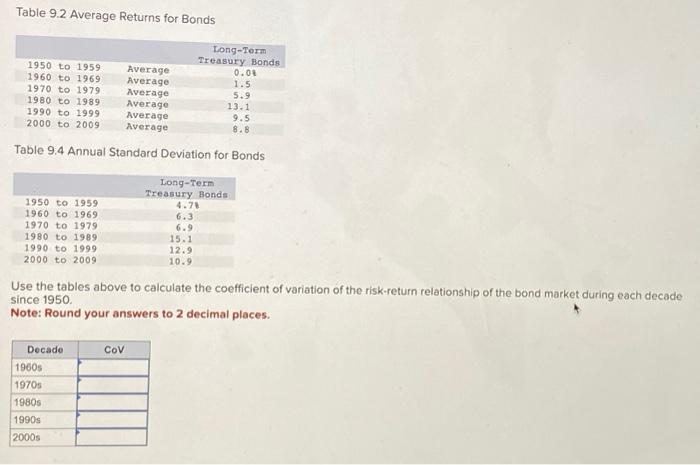
Table 9.2 Average Returns for Bonds 1950 to 1959 1960 to 1969 1970 to 1979 1980 to 1989 1990 to 1999 2000 to 2009 50
Table 9.2 Average Returns for Bonds 1950 to 1959 1960 to 1969 1970 to 1979 1980 to 1989 1990 to 1999 2000 to 2009 50 to 1959 1960 to 1969 1970 to 1979 1980 to 1989 1990 to 1999 2000 to 2009 Table 9.4 Annual Standard Deviation for Bonds Decade Average Average Average Average Average Average 1960s 1970s 1980s 1990s 2000s Long-Term Treasury Bonds COV Long-Term Treasury Bonds Use the tables above to calculate the coefficient of variation of the risk-return relationship of the bond market during each decade since 1950. Note: Round your answers to 2 decimal places. 0.0% 1.5 5.9 13.1 9.5 8.8 4.7% 6.3 6.9 15.1 12.9 10.9
Step by Step Solution
There are 3 Steps involved in it
Step: 1

Get Instant Access to Expert-Tailored Solutions
See step-by-step solutions with expert insights and AI powered tools for academic success
Step: 2

Step: 3
Ace Your Homework with AI
Get the answers you need in no time with our AI-driven, step-by-step assistance
Get Started
Capital And Finance
Authors: Peter Lewin, Nicolás Cachanosky
1st Edition
0367514559, 978-0367514556