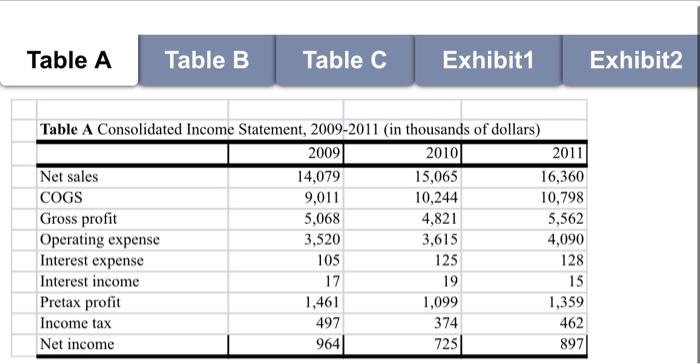
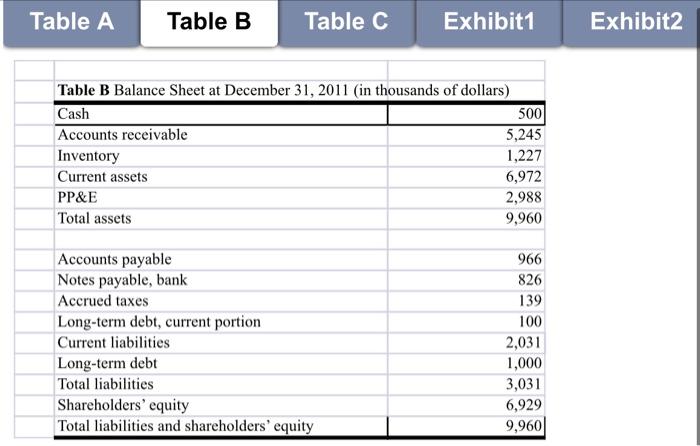
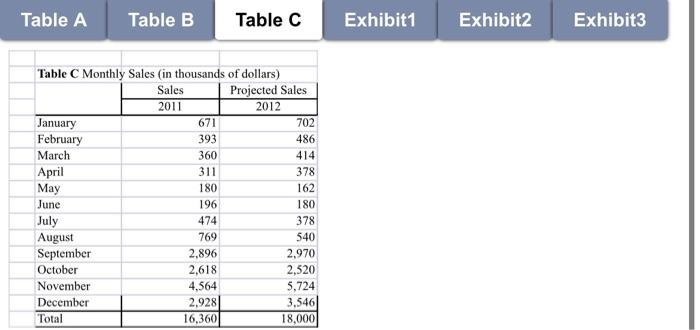
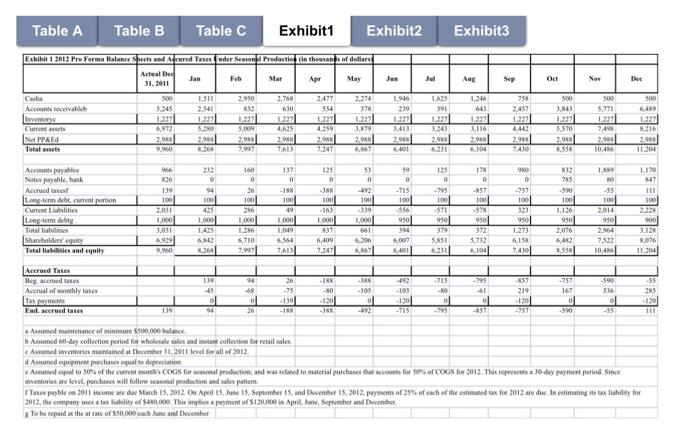
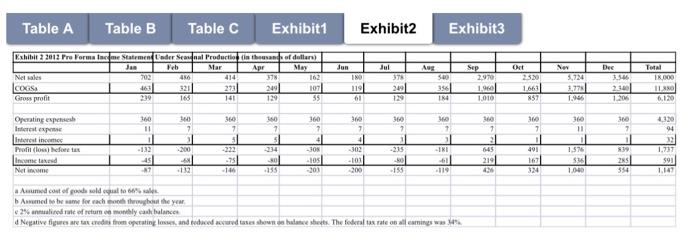
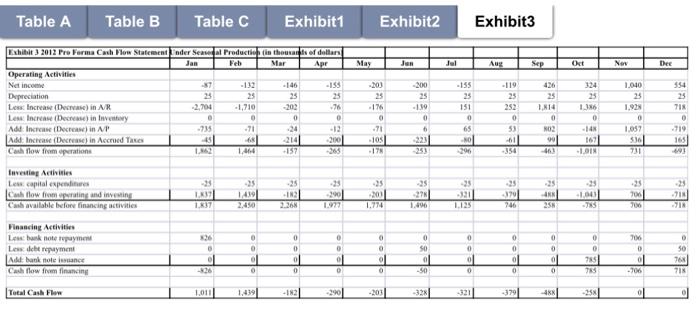
Table A Table B Table C Exhibit1 Exhibit2 Table A Consolidated Income Statement, 2009-2011 (in thousands of dollars) 2009 20101 2011 Net sales 14,079 15,065 16,360 COGS 9,011 10,244 10,798 Gross profit 5,068 4,821 5,562 Operating expense 3,520 3,615 4,090 Interest expense 105 125 128 Interest income 17 19 15 Pretax profit 1,461 1,099 1,359 Income tax 497 374 462 Net income 964 725 897 Table A Table B Table C Exhibit1 Exhibit2 Table B Balance Sheet at December 31, 2011 (in thousands of dollars) Cash 5001 Accounts receivable 5,245 Inventory 1,227 Current assets 6,972 PP&E 2,988 Total assets 9,960 Accounts payable Notes payable, bank Accrued taxes Long-term debt, current portion Current liabilities Long-term debt Total liabilities Shareholders' equity Total liabilities and shareholders' equity 966 826 139 100 2,031 1,000 3,031 6,929 9,960 Table A Table B Table C Exhibit1 Exhibit2 Exhibit3 Table C Monthly Sales (in thousands of dollars) Sales Projected Sales 2011 2012 January 671 702 February 393 486 March 360 414 April 311 378 May 180 162 June 196 180 July 474 378 August 769 540 September 2,896 2,970 October 2,618 2,520 November 4,564 5,724 December 2.928 3,546 Total 16,360 18,000 Table A Table B Table C Exhibit1 Exhibit2 Exhibit3 Exhibit i 2013 Pro Formu Balance Sports and Accured Tasender Sennent Production in the sands of dollars Attuale 31.2011 Jan Feb Mar Apr May Jos Jul Aug Sep Oct Nov Dhee 2.477 500 500 5.24 1.511 2541 1.227 2.76 630 554 1.946 219 37 Cuba Account with Ines Curses Na PPR Totalsts 2.950 133 1227 5.000 20 LAS 191 1.21 1346 641 120 2,116 2013 10 754 2459 1223 500 5.771 1.27 7498 22 1046 4,250 2A 07 500 6,40 1327 8.216 2 11.204 3.679 2. 2018 2008 263 2 7,613 2,983 01 5370 2018 558 29 2.95 7.410 22 90 IX 117 0 25 0 0 -857 94 100 LIN 147 111 100 Accounts payable Naleyhle, bank Accrued aker Long-term dit current portion Curridities Leag term dette Totallies Sharvolder equity Totallities and equity 826 139 1001 2,031 1.000 3.031 929 9,90 -759 100 160 0 26 100 36 1.000 1.286 6710 2.900 59 0 -705 100 356 950 . 1001 49 1.000 1.049 6564 1.6131 53 0 193 100 119 1.000 1 6,206 6267 135 0 -795 100 -571 950 379 551 3K 1001 -163 1.000 37 6,409 7.247 -57 950 1.000 14 6.42 785 -590 100 1.136 950 2.076 42 *.5581 950 1.273 6,15 7430 -95 100 2014 950 2,96 7.522 10,456 6007 6401 3.125 8,076 11,204 3.733 6.100 4231 Accrued Tones Beyecades Achaal of monthly and 94 68 0 45 01 94 26 -75 -1391 TRN -795 61 -IR -30 -120 TAN 492 -103 1201 -los ol 715 -10 01 -357 219 120 -757 167 0 50 -590 536 o1 -55 -55 25 -130 111 Endered are 139 -857 Asumed maten verminim 500.000 Asumed 60-day collection period for wholesale sales and instant collection for retail sales Aceive maintained at December 31, 2011 all of 2012 Asumed equipment pasqual to depin Amel equal to 50% of the current COGS for production and acted to material purchase the count for 50% of COGS for 2012. This 30-dayment period. Since ventories are leve, purchases will follow onal production and sales putium fases paytle 2011 income are de March 15.2012 On April 15, June 15. September 15, and Tecember 15, 2012. payment of of each of the estimated to for 2012 are doinestimating italy for 2012, the companyies a tax liability of $480.000. This implies a payment of 120.000 in April. September and Dember To be paid the art of $50.000 und December Table A Table B Table Exhibit1 Exhibit2 Exhibit3 AN Exhibit 2 2012 Pro Formalneme Statementeder Sendaal Production thaan of dollars) Ja Feb Mar Apr May Netales 703 COXES 4631 320 273 107 Gross profit 239 141 129 Oct 2:30 Dee 1.56 Total IRO 414 378 Jun IN 119 61 Jul 375 249 129 500 356 IR Sep 2970 1960 1.010 Nev 3,724 3.79 1.96 166 55 857 1.206 6.10 w 160 7 5 30 94 Operating expenses Interest Interestinctio Profilowat foreta Income and Net 10 11 1 -132 us 87 2 1 200 360 7 31 -232 75 -14 360 7 41 -30 105 -301 7 4 -303 360 7 11 215 -30 -155 1 -IKI 7 2 645 219 4 We 7 1 491 103 360 11 1 1.57 5 100 30 7 1 39 2 354 -30 -155 1.737 591 114 112 200 -119 Armed cost of gods sold to 6 Armed to be achter the year 2% annualidate of retum a monthly cash balancer Negative figures are tax redes from operating losses, and becedaearyd tuss sowas halate sets. The federal tax rate on all eatings was Table A Table B Table C Exhibit1 Exhibit2 Exhibit3 Apr May Jen Jul Aug Sep Okt Now Dec Exhibit3 2012 Pro Forma Cash Flow Statement Inder Sease al Production in the sky of dollar Jan Feb Mar Operating Activities Net income 37 -133 -146 -135 Depreciation 23 25 25 25 Less Increase (Dee) in AR -2,704 -1,710 -200 76 Les Incre Decrease in love 0 0 0 Add: Increase (Decrease in -71 Add Increase (Decrease in Accrved Thres -45 200 Call flow from operations 1.162 1,4,6 -157 200 25 .17 0 -71 200 25 -1.39 0 6 223 -155 25 151 0 65 NO 296 554 25 TIR -119 25 252 0 53 -61 -354 426 25 1,114 0 NO. 90 461 324 25 1.6 0 1.040 25 1.923 0 -735 1.08 110 2141 -105 ELE 167 LOIN 536 731 165 03 17 uvesting Activities Les capital expedie Cash flow fromating and investing Cash available before financing activities 25 11 17 25 IN 22:26 1430 2.450 -25 200 1.774 -25 27 1.96 -25 -320 1.125 35 370 246 25 4 25 -29 100 7 25 700 7181 18 1.9 26 0 70 Financing Activities Le bank topment Les dhe payment Akbanken Cash flow from financing 0 0 0 0 0 0 0 SO 0 -50 0 0 0 0 0 0 0 0 0 o 0 0 0 75 7 D 01 -706 D 50 764 TI 0 0 0 Total Cash Flow 1.011 390 -203 -328 -3211 -3791 4 0 Table A Table B Table C Exhibit1 Exhibit2 Table A Consolidated Income Statement, 2009-2011 (in thousands of dollars) 2009 20101 2011 Net sales 14,079 15,065 16,360 COGS 9,011 10,244 10,798 Gross profit 5,068 4,821 5,562 Operating expense 3,520 3,615 4,090 Interest expense 105 125 128 Interest income 17 19 15 Pretax profit 1,461 1,099 1,359 Income tax 497 374 462 Net income 964 725 897 Table A Table B Table C Exhibit1 Exhibit2 Table B Balance Sheet at December 31, 2011 (in thousands of dollars) Cash 5001 Accounts receivable 5,245 Inventory 1,227 Current assets 6,972 PP&E 2,988 Total assets 9,960 Accounts payable Notes payable, bank Accrued taxes Long-term debt, current portion Current liabilities Long-term debt Total liabilities Shareholders' equity Total liabilities and shareholders' equity 966 826 139 100 2,031 1,000 3,031 6,929 9,960 Table A Table B Table C Exhibit1 Exhibit2 Exhibit3 Table C Monthly Sales (in thousands of dollars) Sales Projected Sales 2011 2012 January 671 702 February 393 486 March 360 414 April 311 378 May 180 162 June 196 180 July 474 378 August 769 540 September 2,896 2,970 October 2,618 2,520 November 4,564 5,724 December 2.928 3,546 Total 16,360 18,000 Table A Table B Table C Exhibit1 Exhibit2 Exhibit3 Exhibit i 2013 Pro Formu Balance Sports and Accured Tasender Sennent Production in the sands of dollars Attuale 31.2011 Jan Feb Mar Apr May Jos Jul Aug Sep Oct Nov Dhee 2.477 500 500 5.24 1.511 2541 1.227 2.76 630 554 1.946 219 37 Cuba Account with Ines Curses Na PPR Totalsts 2.950 133 1227 5.000 20 LAS 191 1.21 1346 641 120 2,116 2013 10 754 2459 1223 500 5.771 1.27 7498 22 1046 4,250 2A 07 500 6,40 1327 8.216 2 11.204 3.679 2. 2018 2008 263 2 7,613 2,983 01 5370 2018 558 29 2.95 7.410 22 90 IX 117 0 25 0 0 -857 94 100 LIN 147 111 100 Accounts payable Naleyhle, bank Accrued aker Long-term dit current portion Curridities Leag term dette Totallies Sharvolder equity Totallities and equity 826 139 1001 2,031 1.000 3.031 929 9,90 -759 100 160 0 26 100 36 1.000 1.286 6710 2.900 59 0 -705 100 356 950 . 1001 49 1.000 1.049 6564 1.6131 53 0 193 100 119 1.000 1 6,206 6267 135 0 -795 100 -571 950 379 551 3K 1001 -163 1.000 37 6,409 7.247 -57 950 1.000 14 6.42 785 -590 100 1.136 950 2.076 42 *.5581 950 1.273 6,15 7430 -95 100 2014 950 2,96 7.522 10,456 6007 6401 3.125 8,076 11,204 3.733 6.100 4231 Accrued Tones Beyecades Achaal of monthly and 94 68 0 45 01 94 26 -75 -1391 TRN -795 61 -IR -30 -120 TAN 492 -103 1201 -los ol 715 -10 01 -357 219 120 -757 167 0 50 -590 536 o1 -55 -55 25 -130 111 Endered are 139 -857 Asumed maten verminim 500.000 Asumed 60-day collection period for wholesale sales and instant collection for retail sales Aceive maintained at December 31, 2011 all of 2012 Asumed equipment pasqual to depin Amel equal to 50% of the current COGS for production and acted to material purchase the count for 50% of COGS for 2012. This 30-dayment period. Since ventories are leve, purchases will follow onal production and sales putium fases paytle 2011 income are de March 15.2012 On April 15, June 15. September 15, and Tecember 15, 2012. payment of of each of the estimated to for 2012 are doinestimating italy for 2012, the companyies a tax liability of $480.000. This implies a payment of 120.000 in April. September and Dember To be paid the art of $50.000 und December Table A Table B Table Exhibit1 Exhibit2 Exhibit3 AN Exhibit 2 2012 Pro Formalneme Statementeder Sendaal Production thaan of dollars) Ja Feb Mar Apr May Netales 703 COXES 4631 320 273 107 Gross profit 239 141 129 Oct 2:30 Dee 1.56 Total IRO 414 378 Jun IN 119 61 Jul 375 249 129 500 356 IR Sep 2970 1960 1.010 Nev 3,724 3.79 1.96 166 55 857 1.206 6.10 w 160 7 5 30 94 Operating expenses Interest Interestinctio Profilowat foreta Income and Net 10 11 1 -132 us 87 2 1 200 360 7 31 -232 75 -14 360 7 41 -30 105 -301 7 4 -303 360 7 11 215 -30 -155 1 -IKI 7 2 645 219 4 We 7 1 491 103 360 11 1 1.57 5 100 30 7 1 39 2 354 -30 -155 1.737 591 114 112 200 -119 Armed cost of gods sold to 6 Armed to be achter the year 2% annualidate of retum a monthly cash balancer Negative figures are tax redes from operating losses, and becedaearyd tuss sowas halate sets. The federal tax rate on all eatings was Table A Table B Table C Exhibit1 Exhibit2 Exhibit3 Apr May Jen Jul Aug Sep Okt Now Dec Exhibit3 2012 Pro Forma Cash Flow Statement Inder Sease al Production in the sky of dollar Jan Feb Mar Operating Activities Net income 37 -133 -146 -135 Depreciation 23 25 25 25 Less Increase (Dee) in AR -2,704 -1,710 -200 76 Les Incre Decrease in love 0 0 0 Add: Increase (Decrease in -71 Add Increase (Decrease in Accrved Thres -45 200 Call flow from operations 1.162 1,4,6 -157 200 25 .17 0 -71 200 25 -1.39 0 6 223 -155 25 151 0 65 NO 296 554 25 TIR -119 25 252 0 53 -61 -354 426 25 1,114 0 NO. 90 461 324 25 1.6 0 1.040 25 1.923 0 -735 1.08 110 2141 -105 ELE 167 LOIN 536 731 165 03 17 uvesting Activities Les capital expedie Cash flow fromating and investing Cash available before financing activities 25 11 17 25 IN 22:26 1430 2.450 -25 200 1.774 -25 27 1.96 -25 -320 1.125 35 370 246 25 4 25 -29 100 7 25 700 7181 18 1.9 26 0 70 Financing Activities Le bank topment Les dhe payment Akbanken Cash flow from financing 0 0 0 0 0 0 0 SO 0 -50 0 0 0 0 0 0 0 0 0 o 0 0 0 75 7 D 01 -706 D 50 764 TI 0 0 0 Total Cash Flow 1.011 390 -203 -328 -3211 -3791 4 0
