Answered step by step
Verified Expert Solution
Question
1 Approved Answer
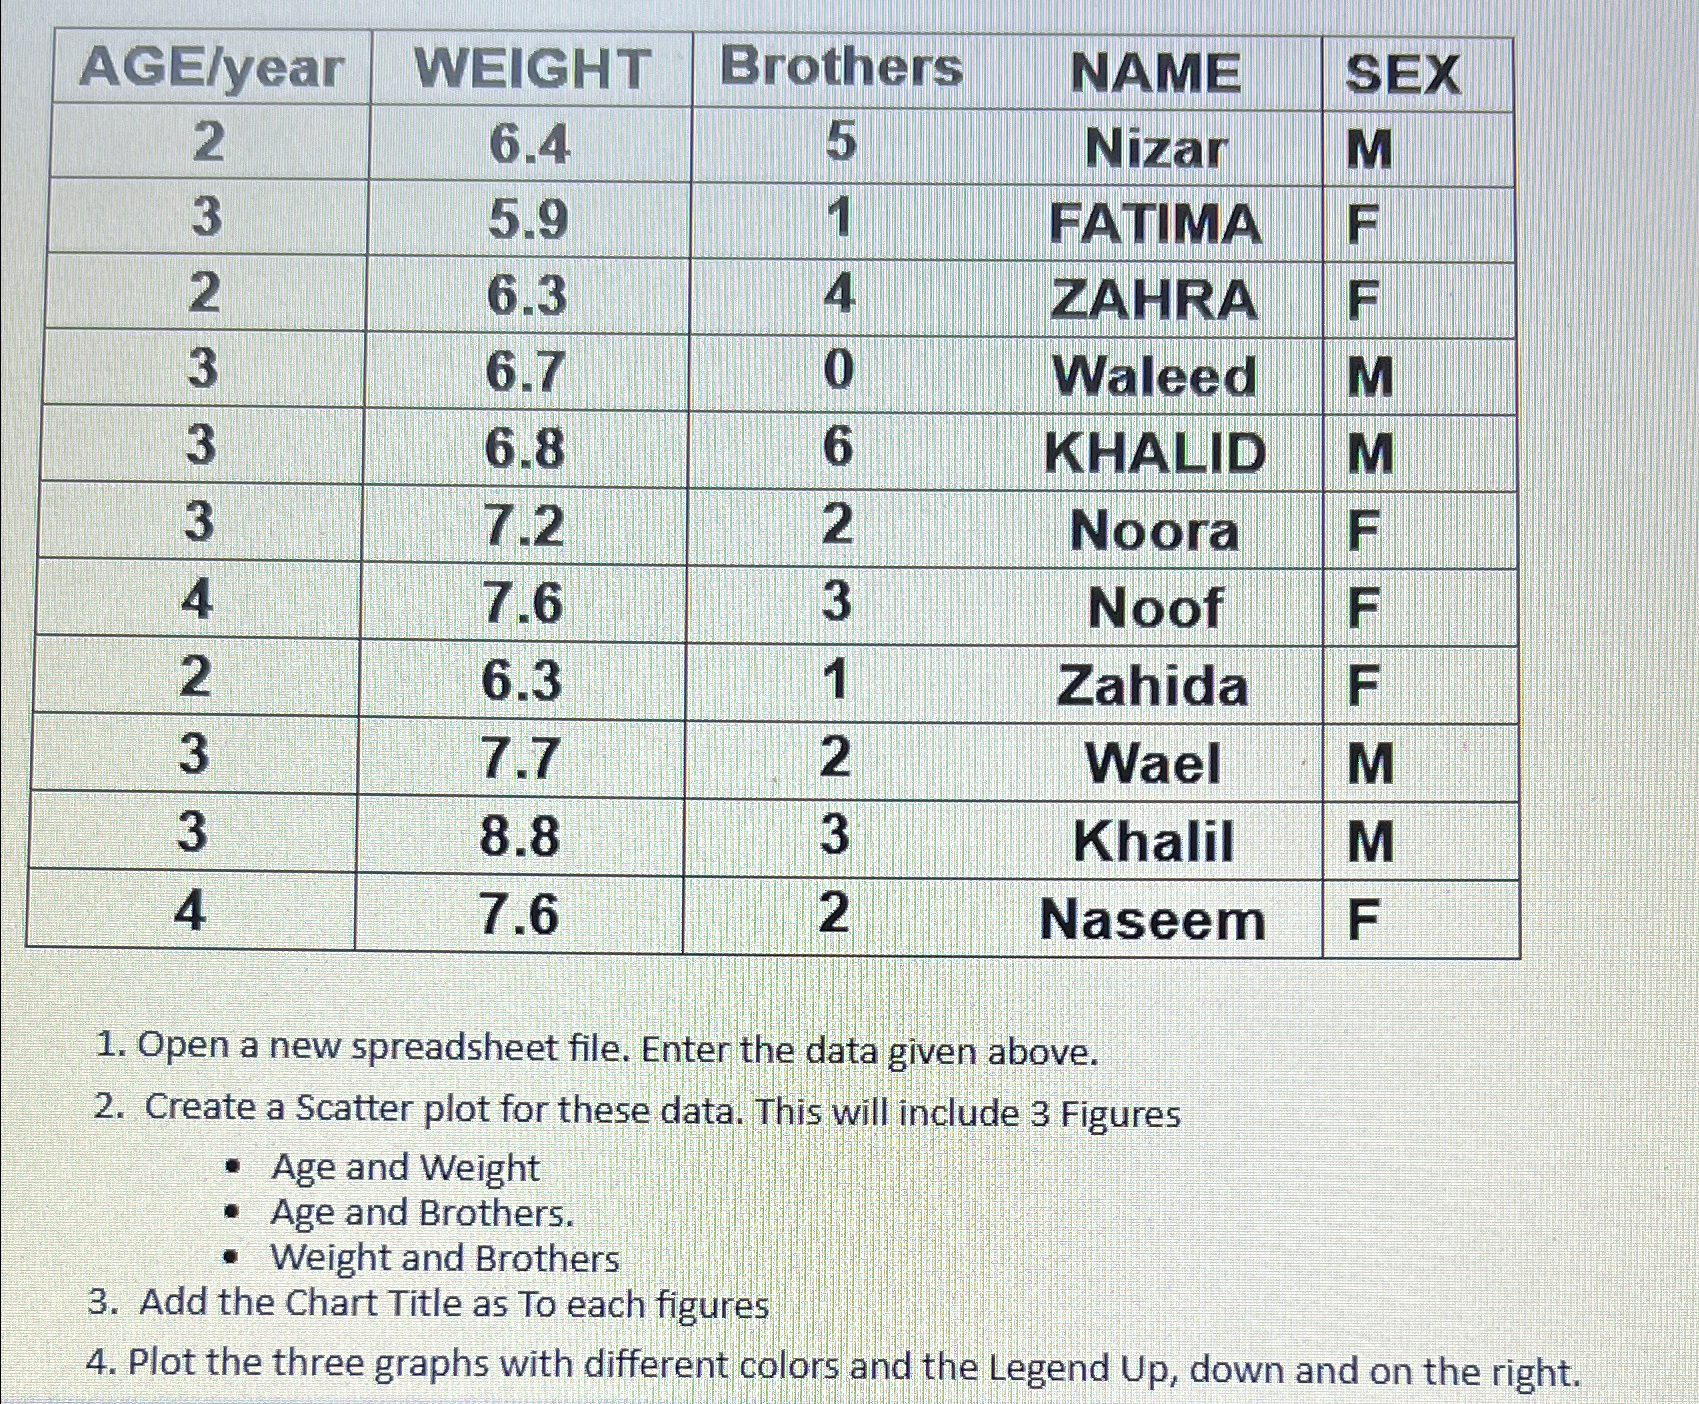
table [ [ AGE / year , WEIGHT,Brothers,NAME,SEX ] , [ 2 , 6 . 4 , 5 , Nizar,M ] , [ 3
tableAGEyearWEIGHT,Brothers,NAME,SEXNizar,MFATIMA,FZAHRA,FWaleed,MKHALID,MNoora,FNoof,FZahida,FWael,MKhalil,MNaseem,F
Open a new spreadsheet file. Enter the data given above.
Create a Scatter plot for these data. This will include Figures
Age and Weight
Age and Brothers.
Weight and Brothers
Add the Chart Title as To each figures
Plot the three graphs with different colors and the Legend Up down and on the right. I want the solve in excel sheet by image

Step by Step Solution
There are 3 Steps involved in it
Step: 1

Get Instant Access to Expert-Tailored Solutions
See step-by-step solutions with expert insights and AI powered tools for academic success
Step: 2

Step: 3

Ace Your Homework with AI
Get the answers you need in no time with our AI-driven, step-by-step assistance
Get Started


