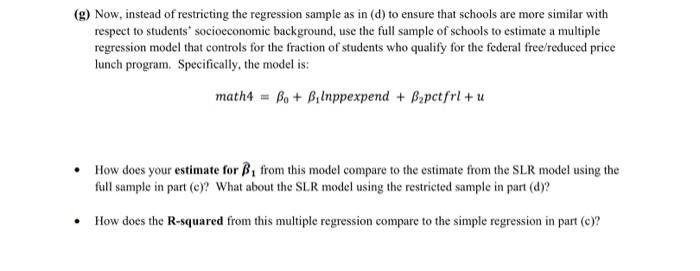
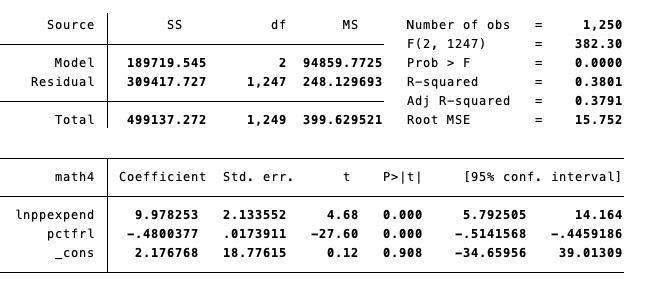
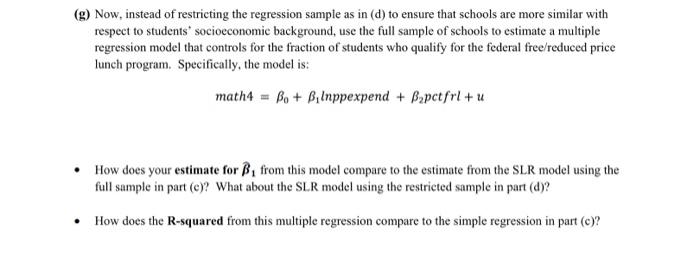
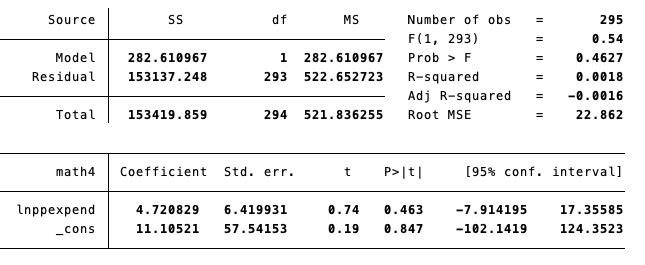
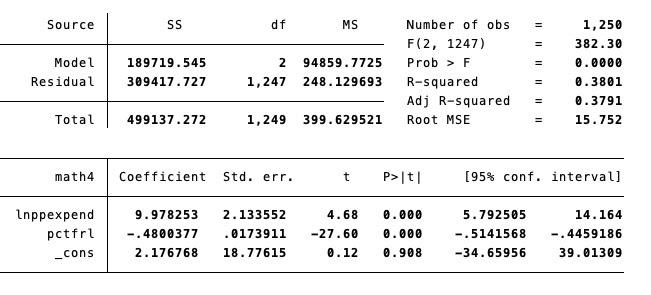
(g) Now, instead of restricting the regression sample as in (d) to ensure that schools are more similar with respect to students' socioeconomic background, use the full sample of schools to estimate a multiple regression model that controls for the fraction of students who qualify for the federal free/reduced price lunch program. Specifically, the model is: math4=0+1lnppexpend+2pctfrl+u - How does your estimate for 1 from this model compare to the estimate from the SLR model using the full sample in part (c)? What about the SLR model using the restricted sample in part (d)? - How does the R-squared from this multiple regression compare to the simple regression in part (c)? (g) Now, instead of restricting the regression sample as in (d) to ensure that schools are more similar with respect to students' socioeconomic background, use the full sample of schools to estimate a multiple regression model that controls for the fraction of students who qualify for the federal free/reduced price lunch program. Specifically, the model is: math4=0+1lnppexpend+2pctfrl+u - How does your estimate for 1 from this model compare to the estimate from the SLR model using the full sample in part (c)? What about the SLR model using the restricted sample in part (d)? - How does the R-squared from this multiple regression compare to the simple regression in part (c)? \begin{tabular}{r|rrrrrr} \hline math4 & Coefficient & Std.err. & t & P>t & [958 conf. interval] \\ \hline lnppexpend & 4.720829 & 6.419931 & 0.74 & 0.463 & 7.914195 & 17.35585 \\ _cons & 11.10521 & 57.54153 & 0.19 & 0.847 & 102.1419 & 124.3523 \\ \hline \end{tabular} (g) Now, instead of restricting the regression sample as in (d) to ensure that schools are more similar with respect to students' socioeconomic background, use the full sample of schools to estimate a multiple regression model that controls for the fraction of students who qualify for the federal free/reduced price lunch program. Specifically, the model is: math4=0+1lnppexpend+2pctfrl+u - How does your estimate for 1 from this model compare to the estimate from the SLR model using the full sample in part (c)? What about the SLR model using the restricted sample in part (d)? - How does the R-squared from this multiple regression compare to the simple regression in part (c)? (g) Now, instead of restricting the regression sample as in (d) to ensure that schools are more similar with respect to students' socioeconomic background, use the full sample of schools to estimate a multiple regression model that controls for the fraction of students who qualify for the federal free/reduced price lunch program. Specifically, the model is: math4=0+1lnppexpend+2pctfrl+u - How does your estimate for 1 from this model compare to the estimate from the SLR model using the full sample in part (c)? What about the SLR model using the restricted sample in part (d)? - How does the R-squared from this multiple regression compare to the simple regression in part (c)? \begin{tabular}{r|rrrrrr} \hline math4 & Coefficient & Std.err. & t & P>t & [958 conf. interval] \\ \hline lnppexpend & 4.720829 & 6.419931 & 0.74 & 0.463 & 7.914195 & 17.35585 \\ _cons & 11.10521 & 57.54153 & 0.19 & 0.847 & 102.1419 & 124.3523 \\ \hline \end{tabular}
