Answered step by step
Verified Expert Solution
Question
1 Approved Answer
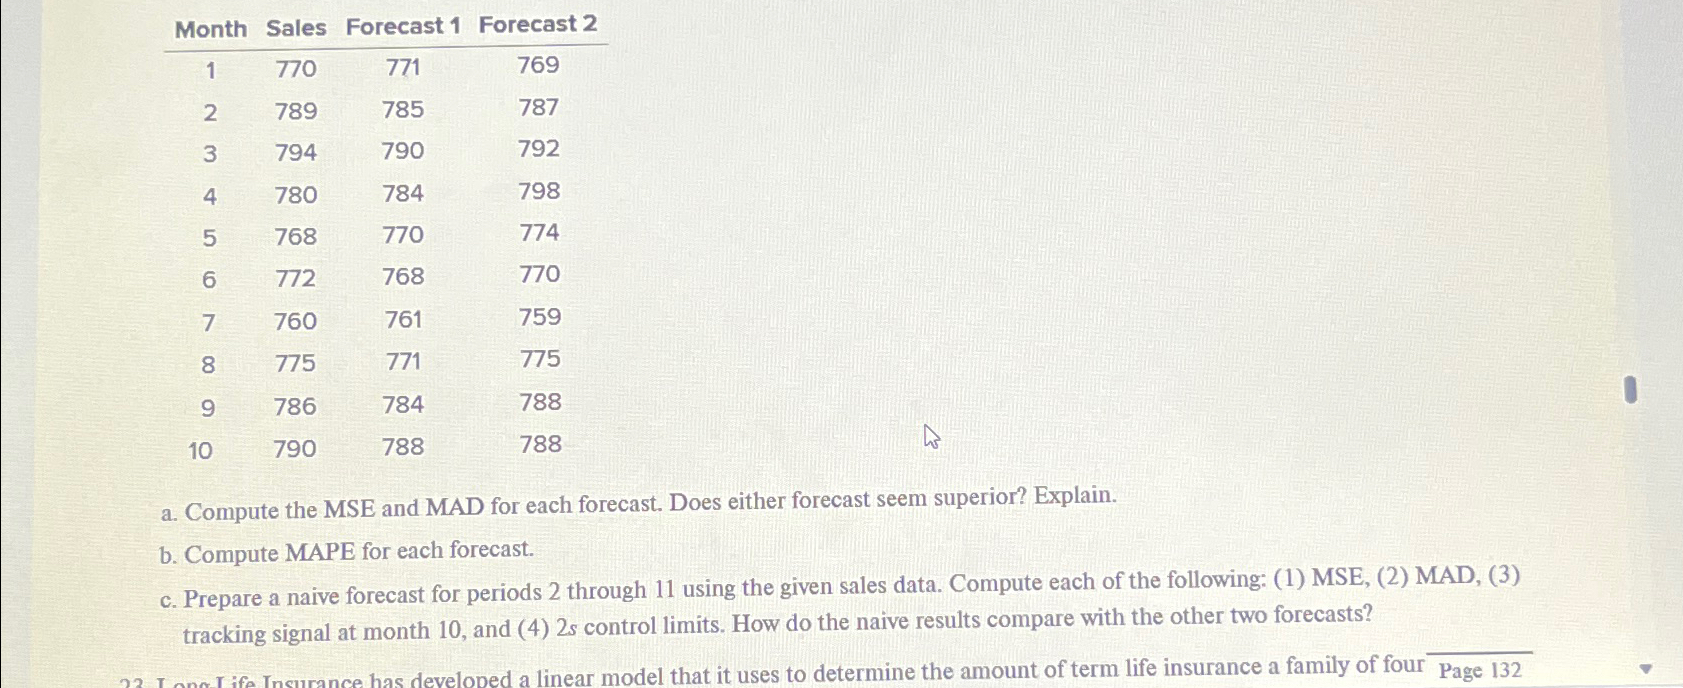
table [ [ Month , Sales,Forecast 1 , Forecast 2 ] , [ 1 , 7 7 0 , 7 7 1 , 7
tableMonthSales,Forecast Forecast
a Compute the MSE and MAD for each forecast. Does either forecast seem superior? Explain.
b Compute MAPE for each forecast.
c Prepare a naive forecast for periods through using the given sales data. Compute each of the following: MSE, MAD, tracking signal at month and control limits How do the naive results compare with the other two forecasts?
develoned a linear model that it uses to determine the amount of term life insurance a family of four Page

Step by Step Solution
There are 3 Steps involved in it
Step: 1

Get Instant Access to Expert-Tailored Solutions
See step-by-step solutions with expert insights and AI powered tools for academic success
Step: 2

Step: 3

Ace Your Homework with AI
Get the answers you need in no time with our AI-driven, step-by-step assistance
Get Started


