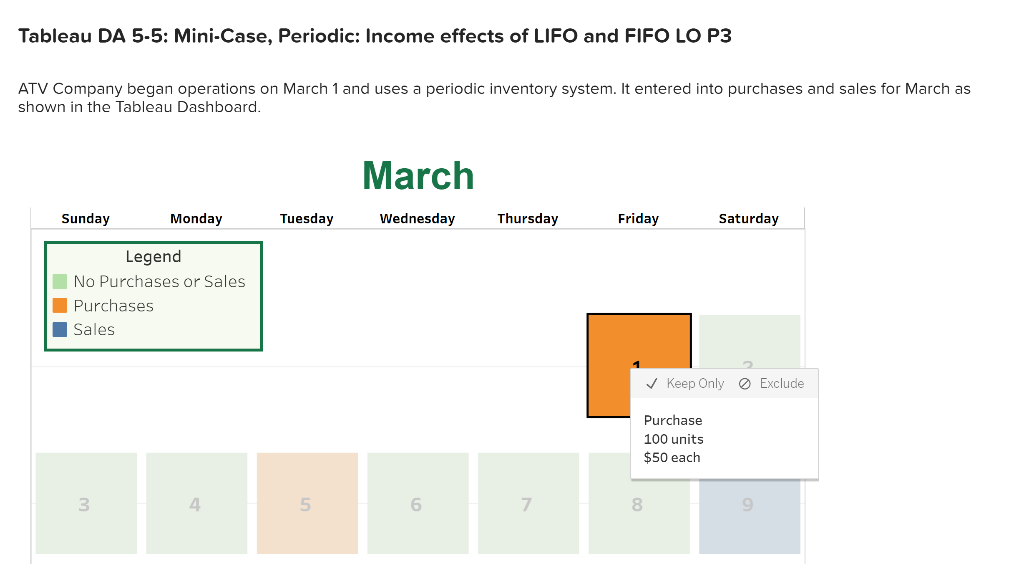
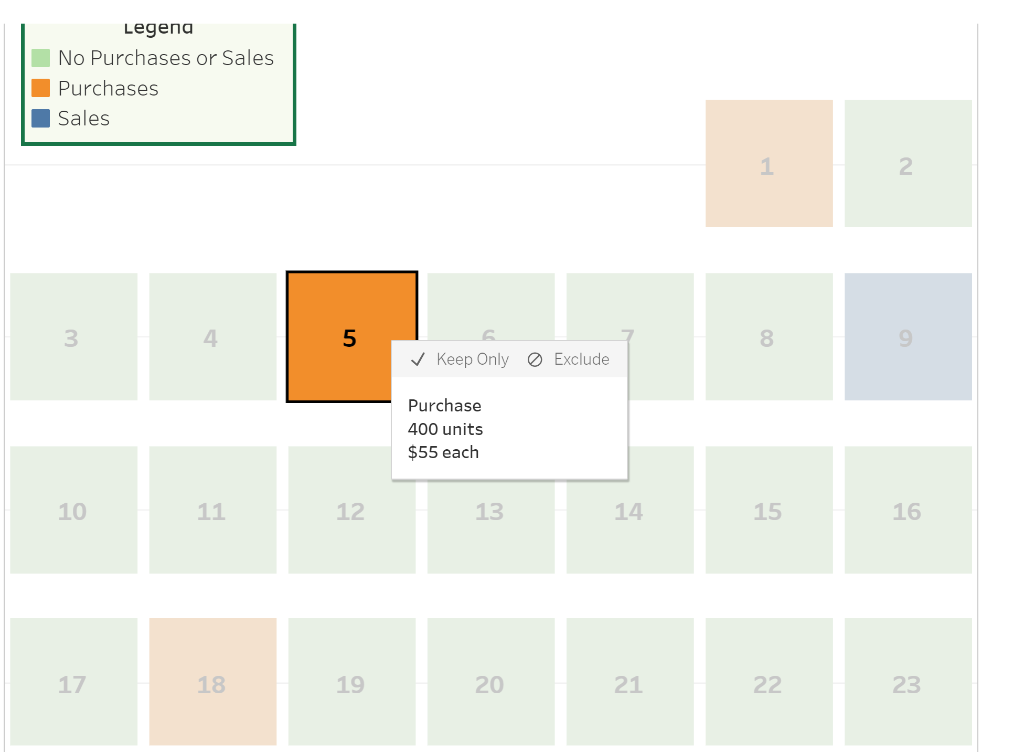
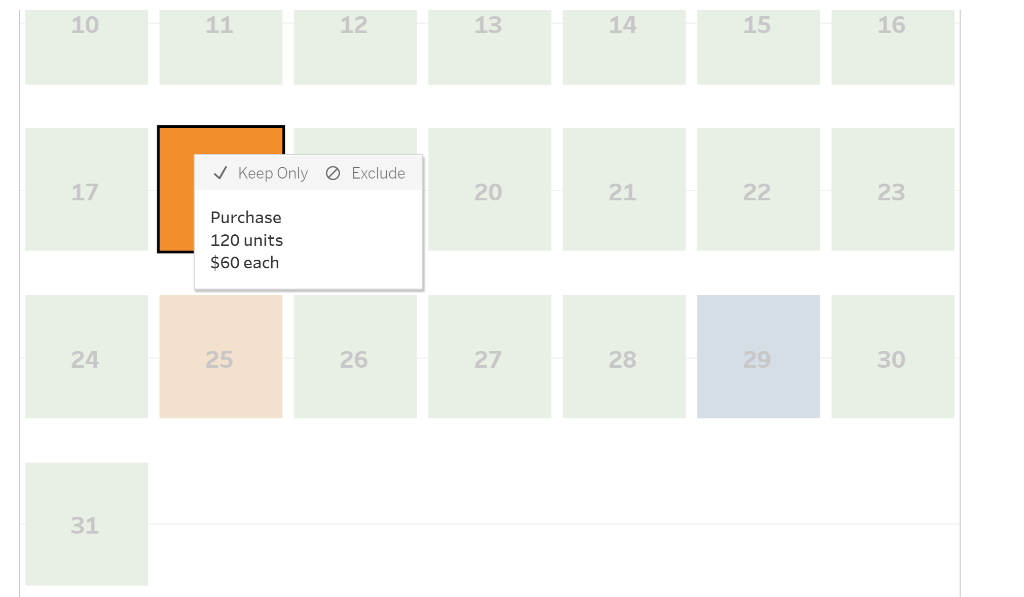
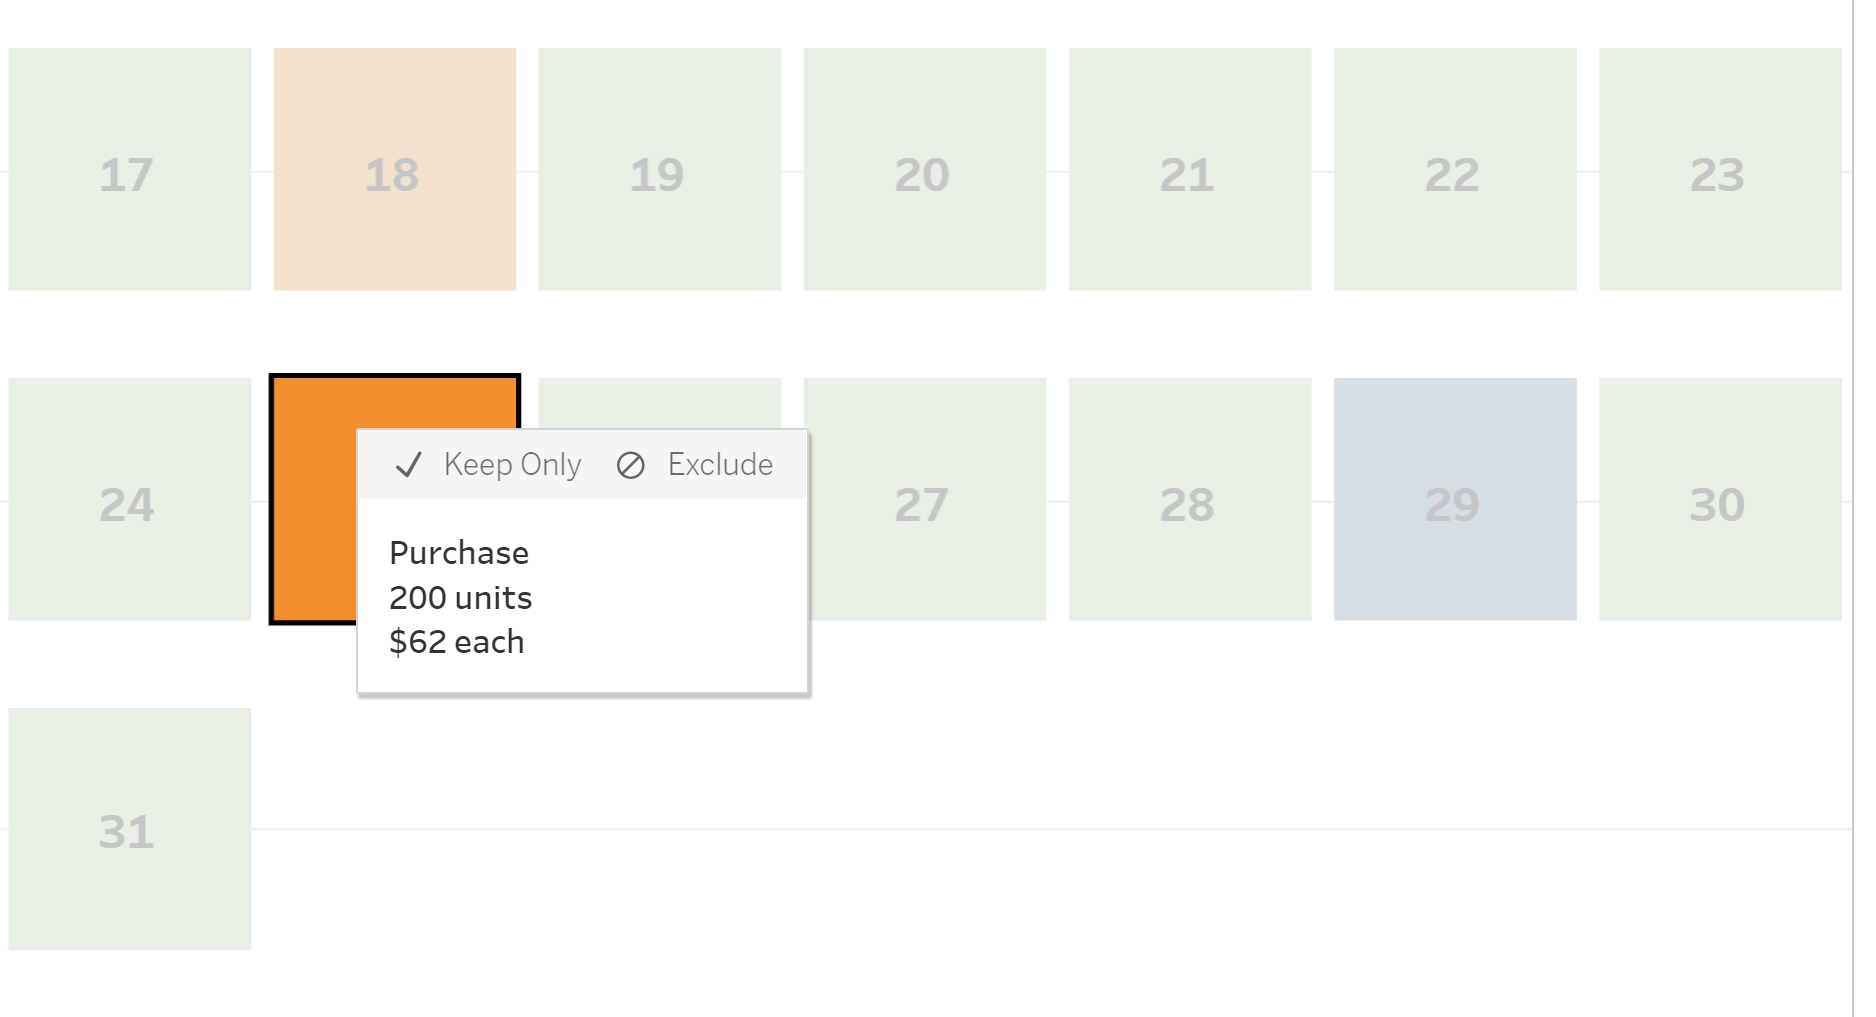
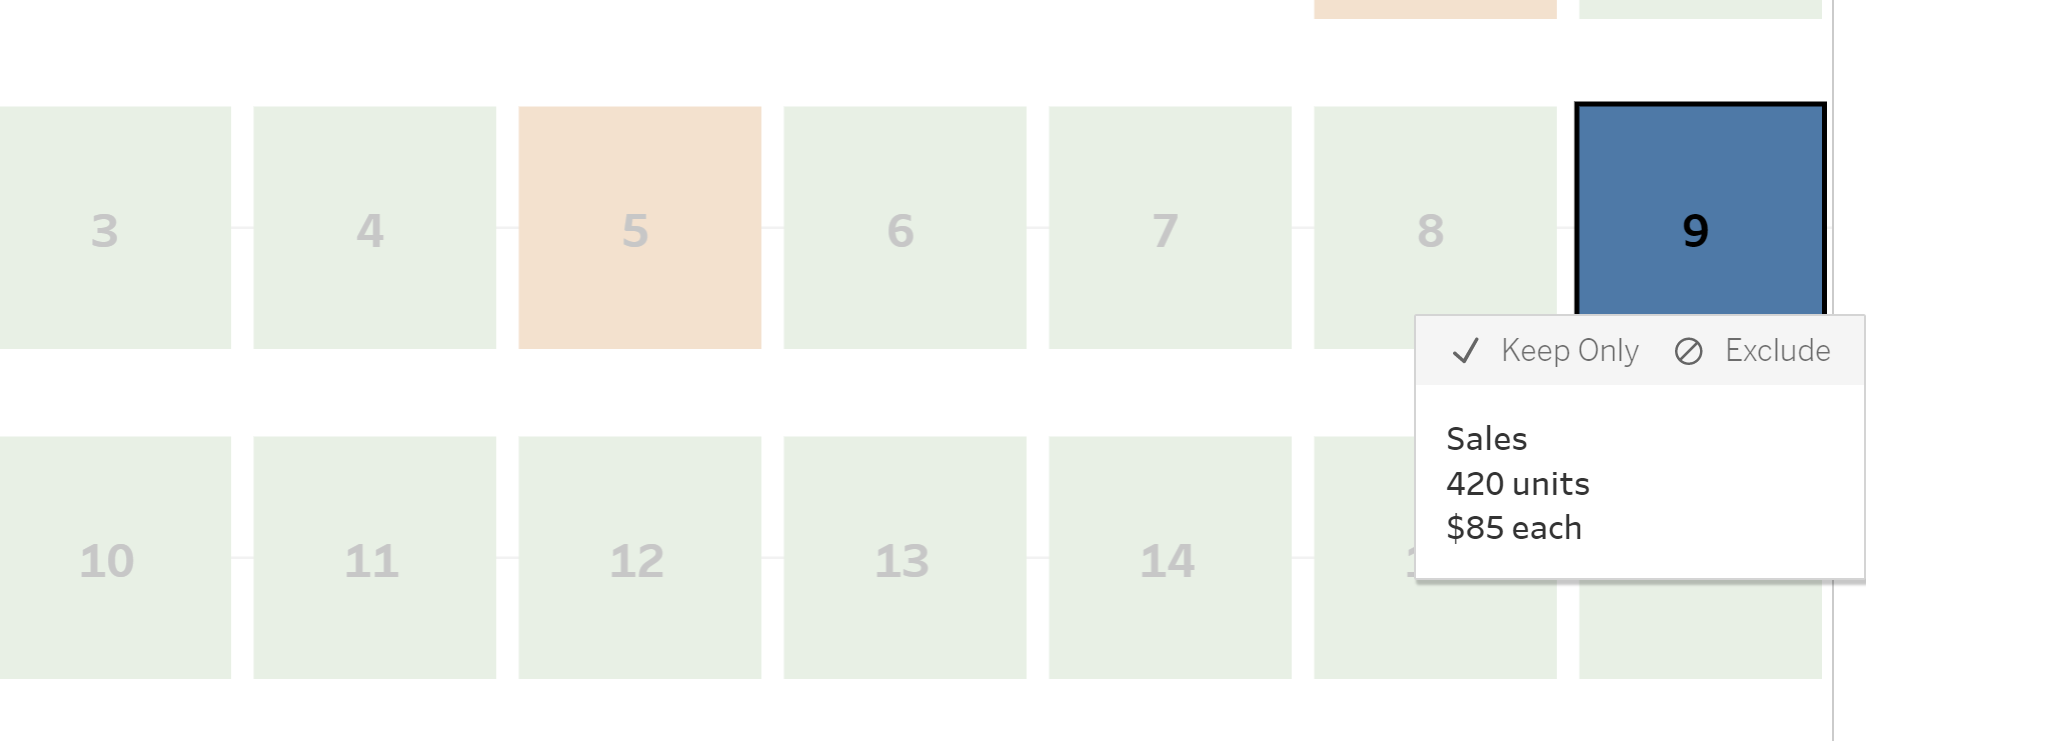
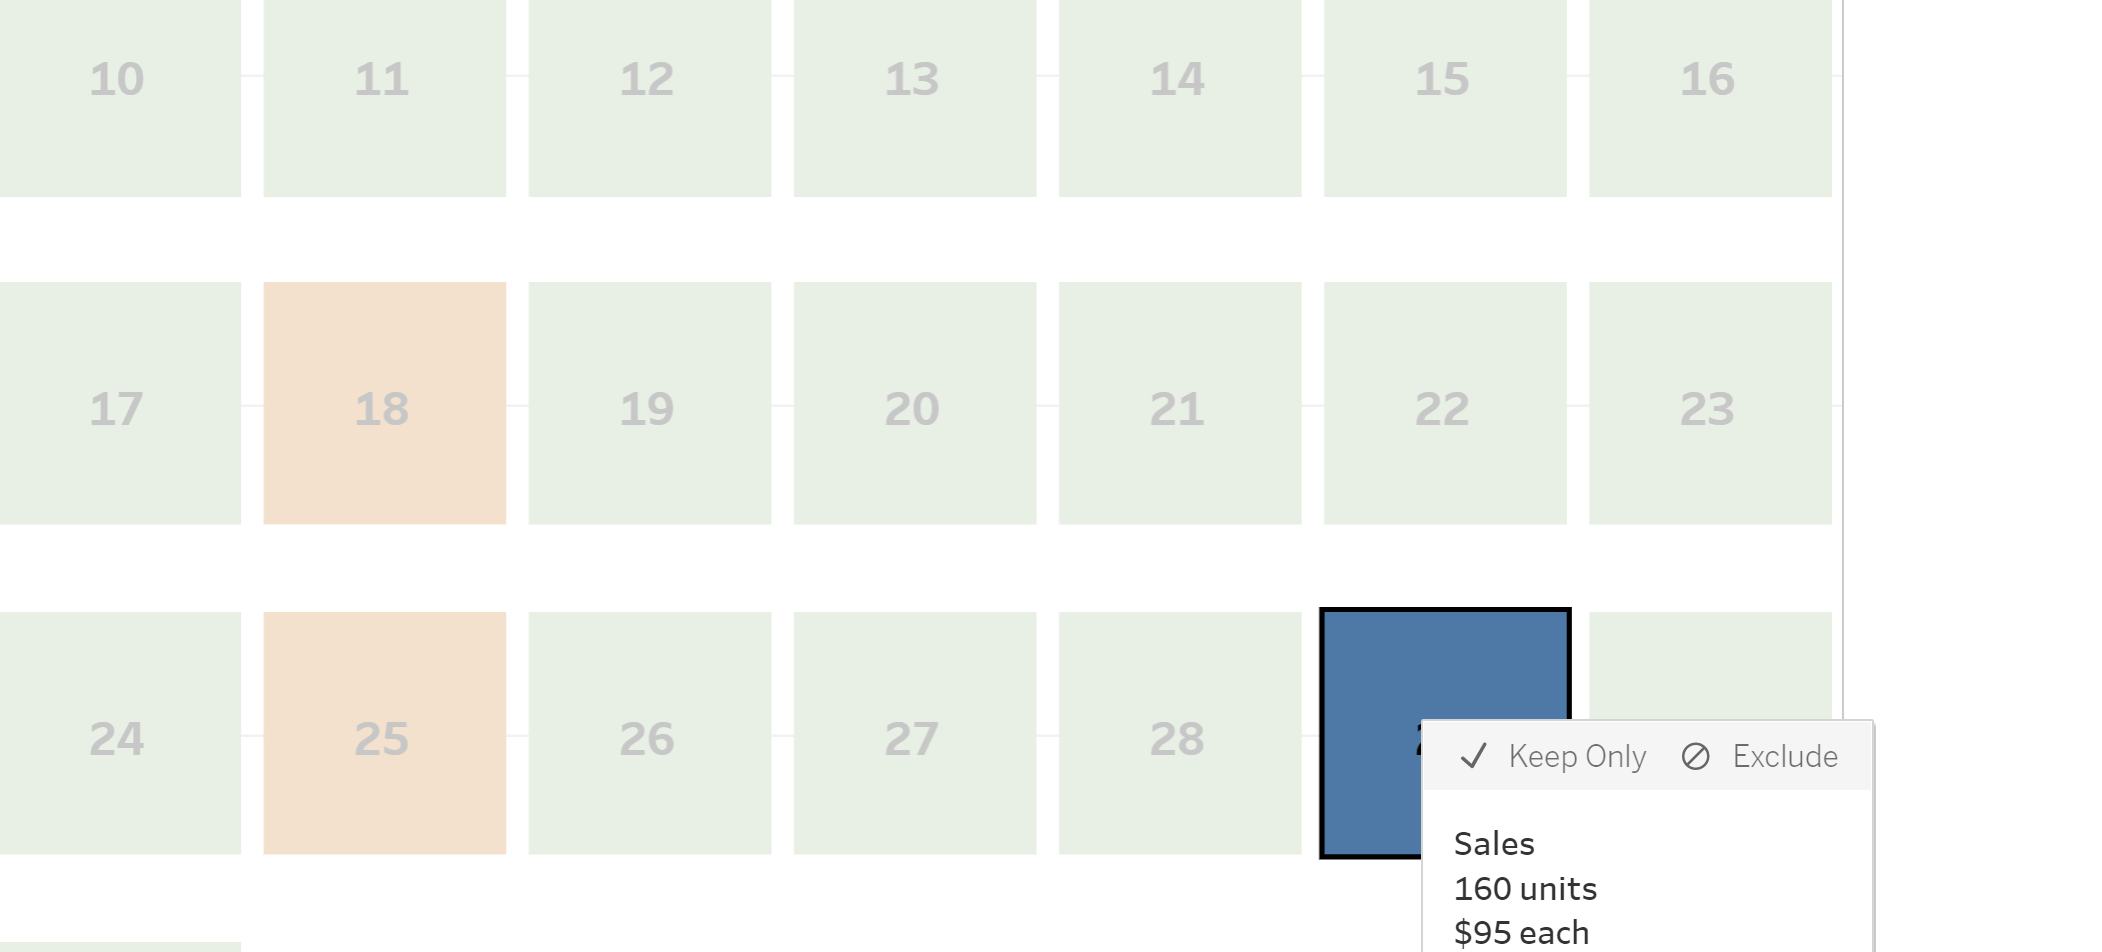

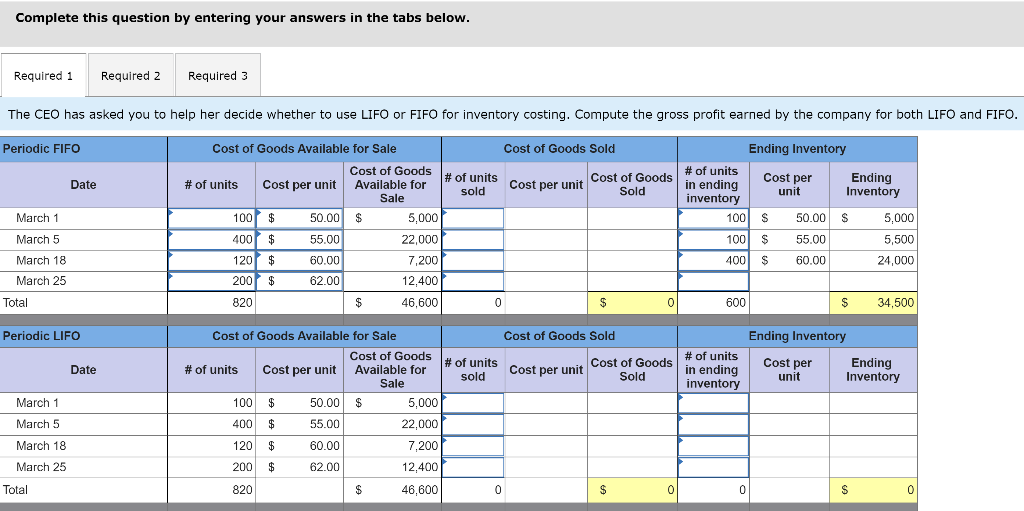
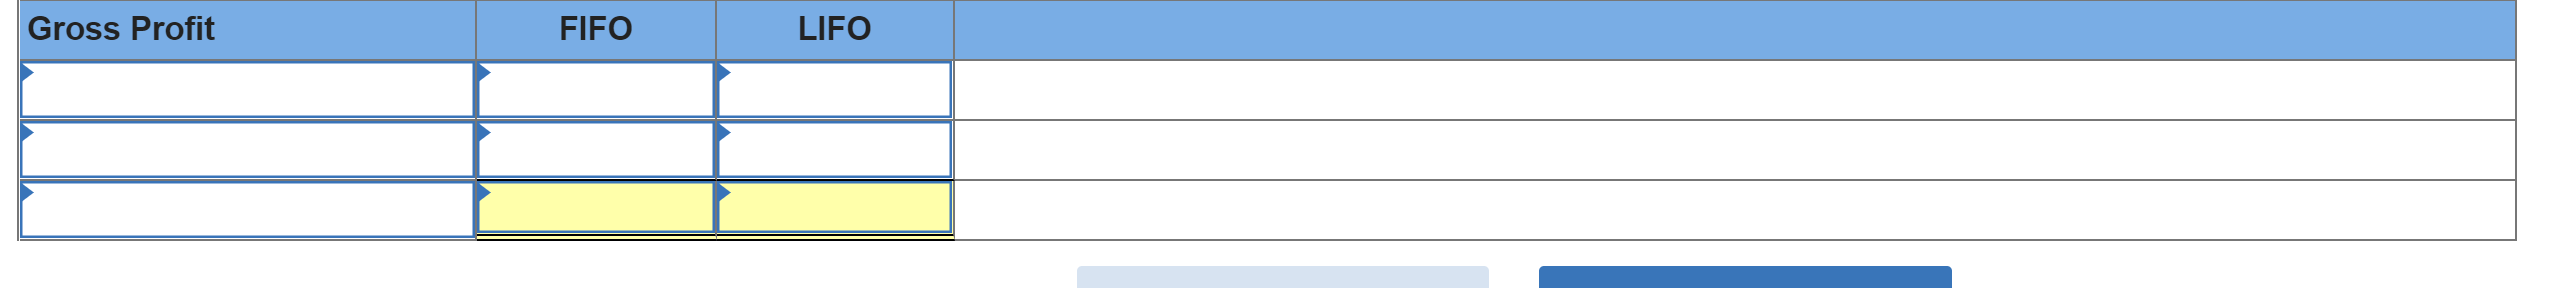
Tableau DA 5-5: Mini-Case, Periodic: Income effects of LIFO and FIFO LO P3 ATV Company began operations on March 1 and uses a periodic inventory system. It entered into purchases and sales for March as shown in the Tableau Dashboard. March Sunday Monday Tuesday Wednesday Thursday Friday Saturday Legend No Purchases or Sales Purchases Sales Keep Only Exclude Purchase 100 units $50 each 3 4 5 8 Legena No Purchases or Sales Purchases Sales 2 3 4 5 8. 9 Keep Only Exclude Purchase 400 units $55 each 10 11 12 13 14 15 16 17 18 19 20 21 22 23 10 11 12 13 14 15 16 Keep Only Exclude 17 20 21 22. 23 Purchase 120 units $60 each 24. 25 26 27 28 29 30 31 17 18 19 20 21 22 23. Keep Only 0 Exclude 24 27 28 29 30 Purchase 200 units $62 each 31 3. 4 5 6 7. 8 9 Keep Only 0 Exclude Sales 420 units $85 each 10 11 12 13 14 10. 11 12 13 14 15 16 . 17 18 19 20 21 22. 23 24 25 26 27 28 Keep Only 0 Exclude Sales 160 units $95 each 1. The CEO has asked you to help her decide whether to use LIFO or FIFO for inventory costing. Compute the gross profit earned by the company for both LIFO and FIFO. 2. The CEO's bonus is calculated using net income before income taxes. If the CEO wishes to maximize her bonus, which of the following methods would you recommend? 3. Alternatively, the CEO desires the method that minimizes income taxes paid by the company in the current year. If income taxes are based on a percentage of net income, which method would you recommend to the CEO? Complete this question by entering your answers in the tabs below. Required 1 Required 2 Required 3 The CEO has asked you to help her decide whether to use LIFO or FIFO for inventory costing. Compute the gross profit earned by the company for both LIFO and FIFO. Periodic FIFO Cost of Goods Sold Date # of units Cost per unit Cost of Goods Sold sold Ending Inventory # of units Ending Cost per in ending unit Inventory inventory 100 $ 50.00 $ 5,000 100 $ 55.00 5,500 400 $ 60.00 24,000 March 1 Cost of Goods Available for Sale Cost of Goods # of units Cost per unit Available for Sale 100 $ 50.00 $ $ 5,000 400 $ 55.00 22,000 120 $ 60.00 7,200 200 $ 62.00 12,400 820 $ 46,600 March 5 March 18 March 25 Total 0 $ 0 600 $ $ 34,500 Periodic LIFO Date Ending Inventory Cost per Ending unit Inventory Cost of Goods # of units in ending inventory March 1 March 5 Cost of Goods Available for Sale Cost of Goods Sold Cost of Goods # of units Cost per unit Available for # of units sold Cost per unit Sale Sold 100 $ 50.00 $ 5,000 400 $ 55.00 22,000 120 $ 60.00 7,200 200 $ 62.00 12,400 March 18 March 25 Total 820 $ 46,600 0 0 $ 0 0 S 0 Gross Profit FIFO LIFO