

Answered step by step
Verified Expert Solution
Question
1 Approved Answer
Tableau Dashboard Activity 3-1 Analyzing Income Statement Items and Net Profit Margin Use the controls on the right to manipulate the Tableau visualization to answer
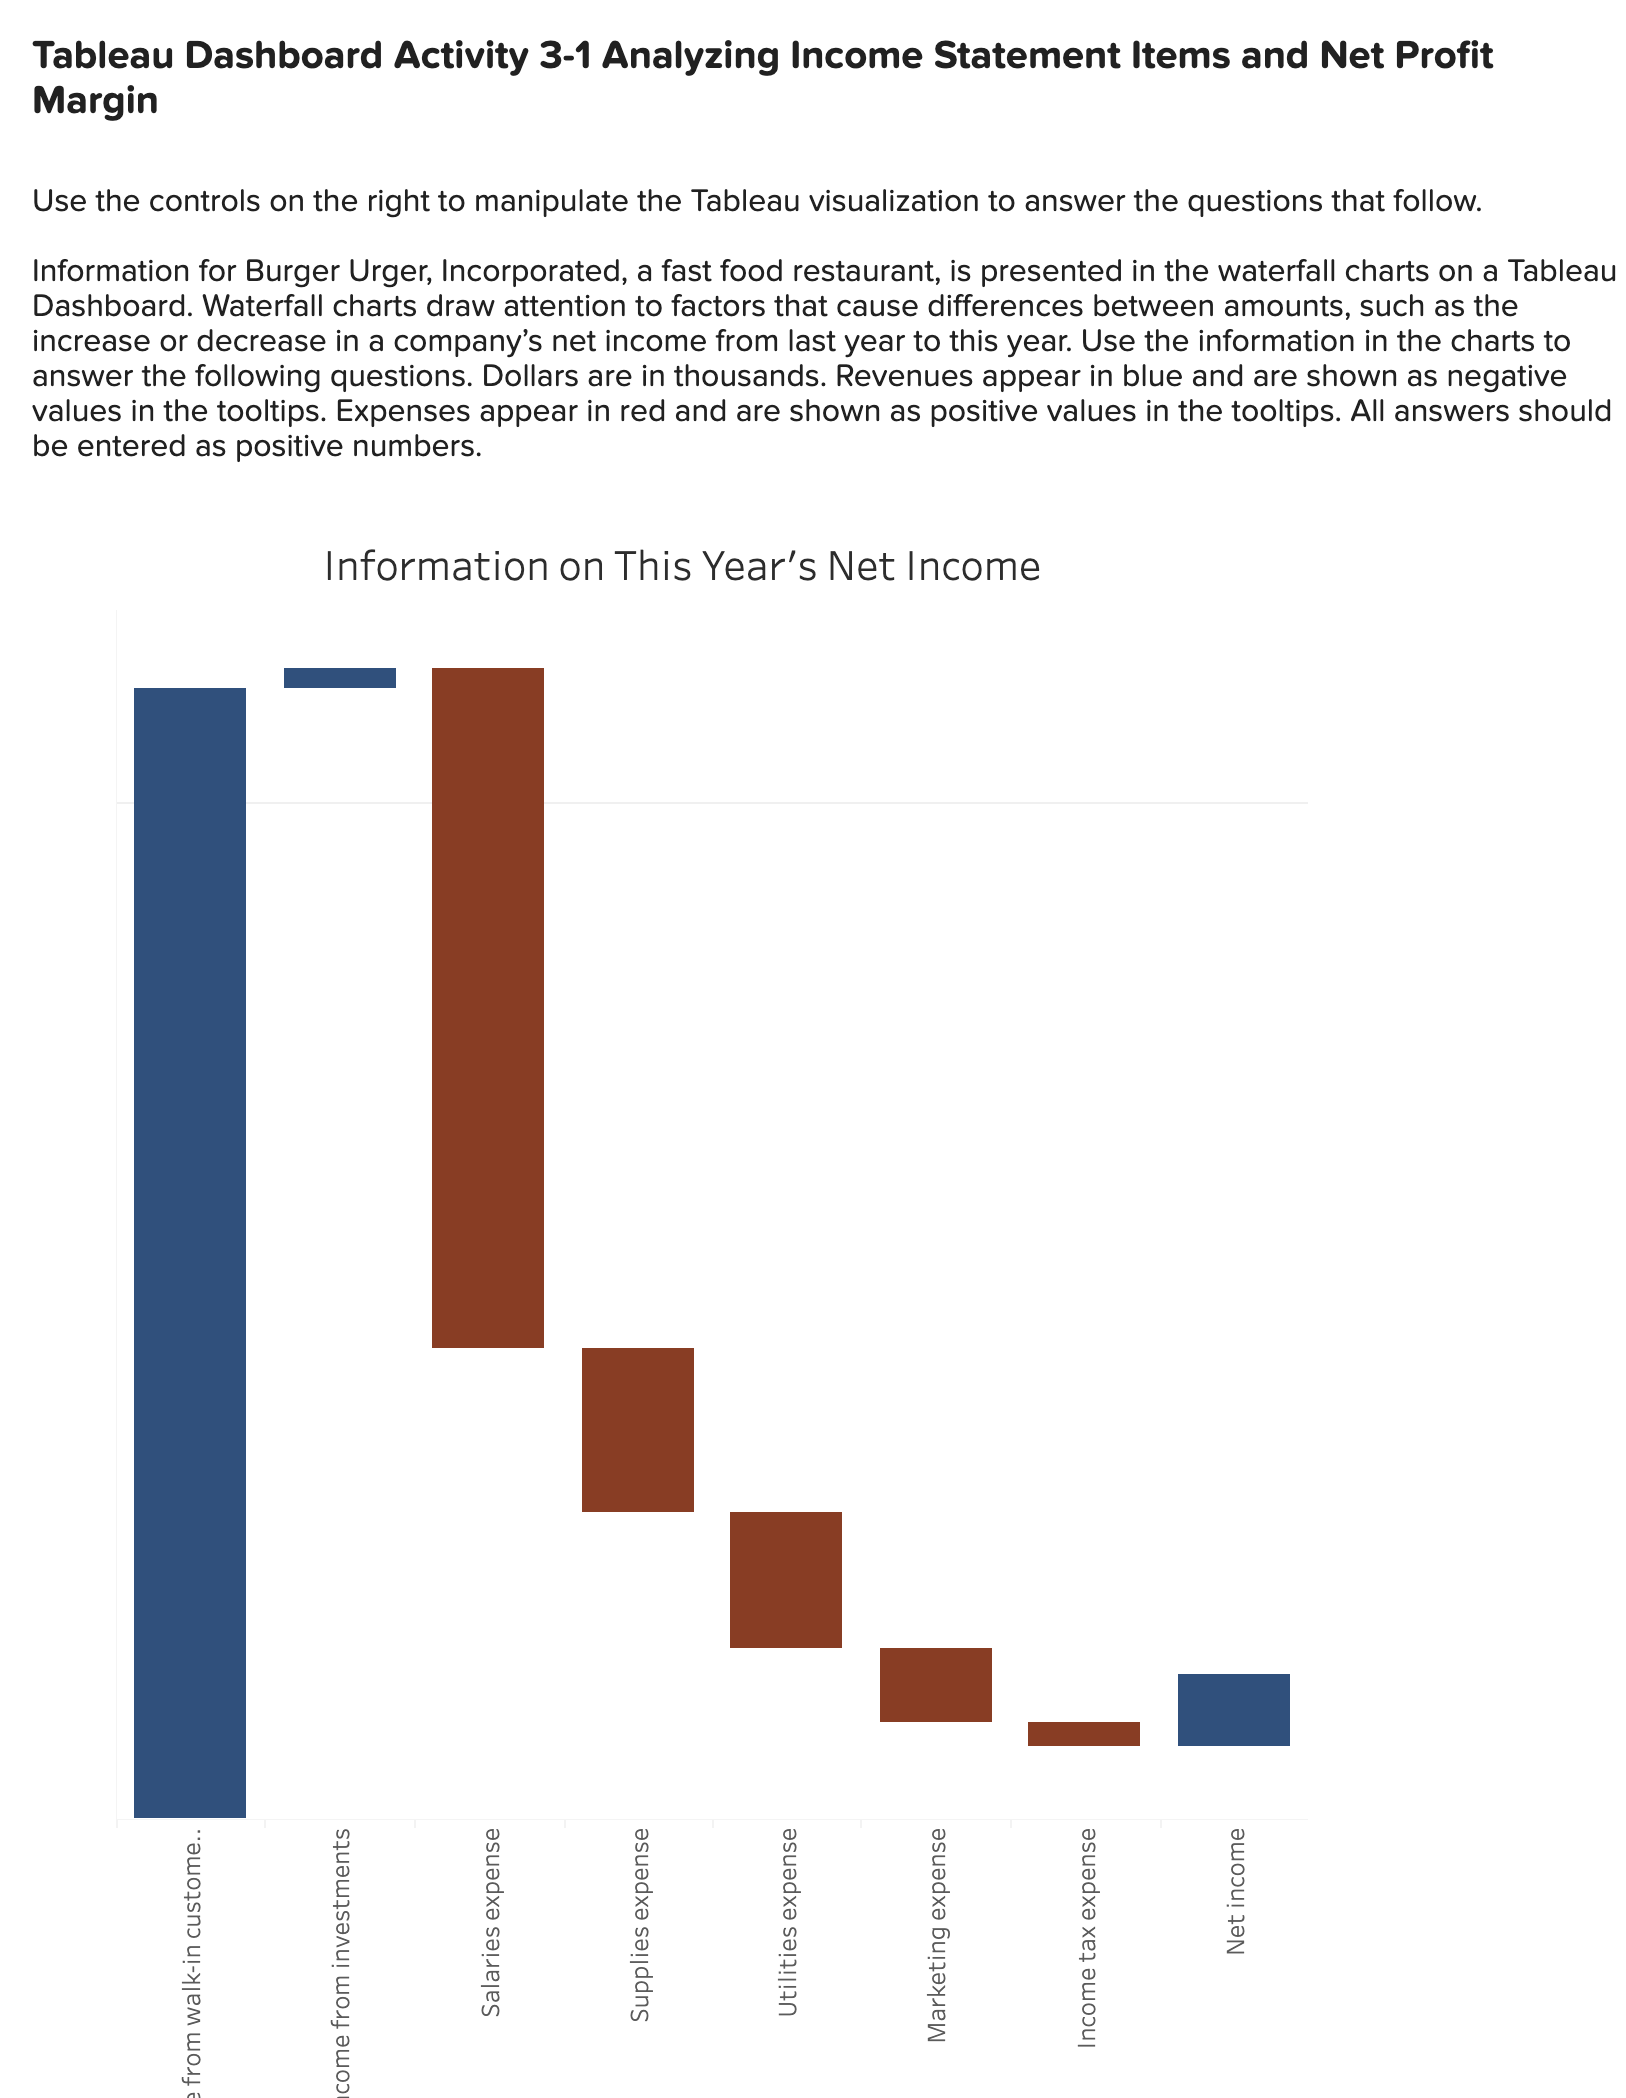
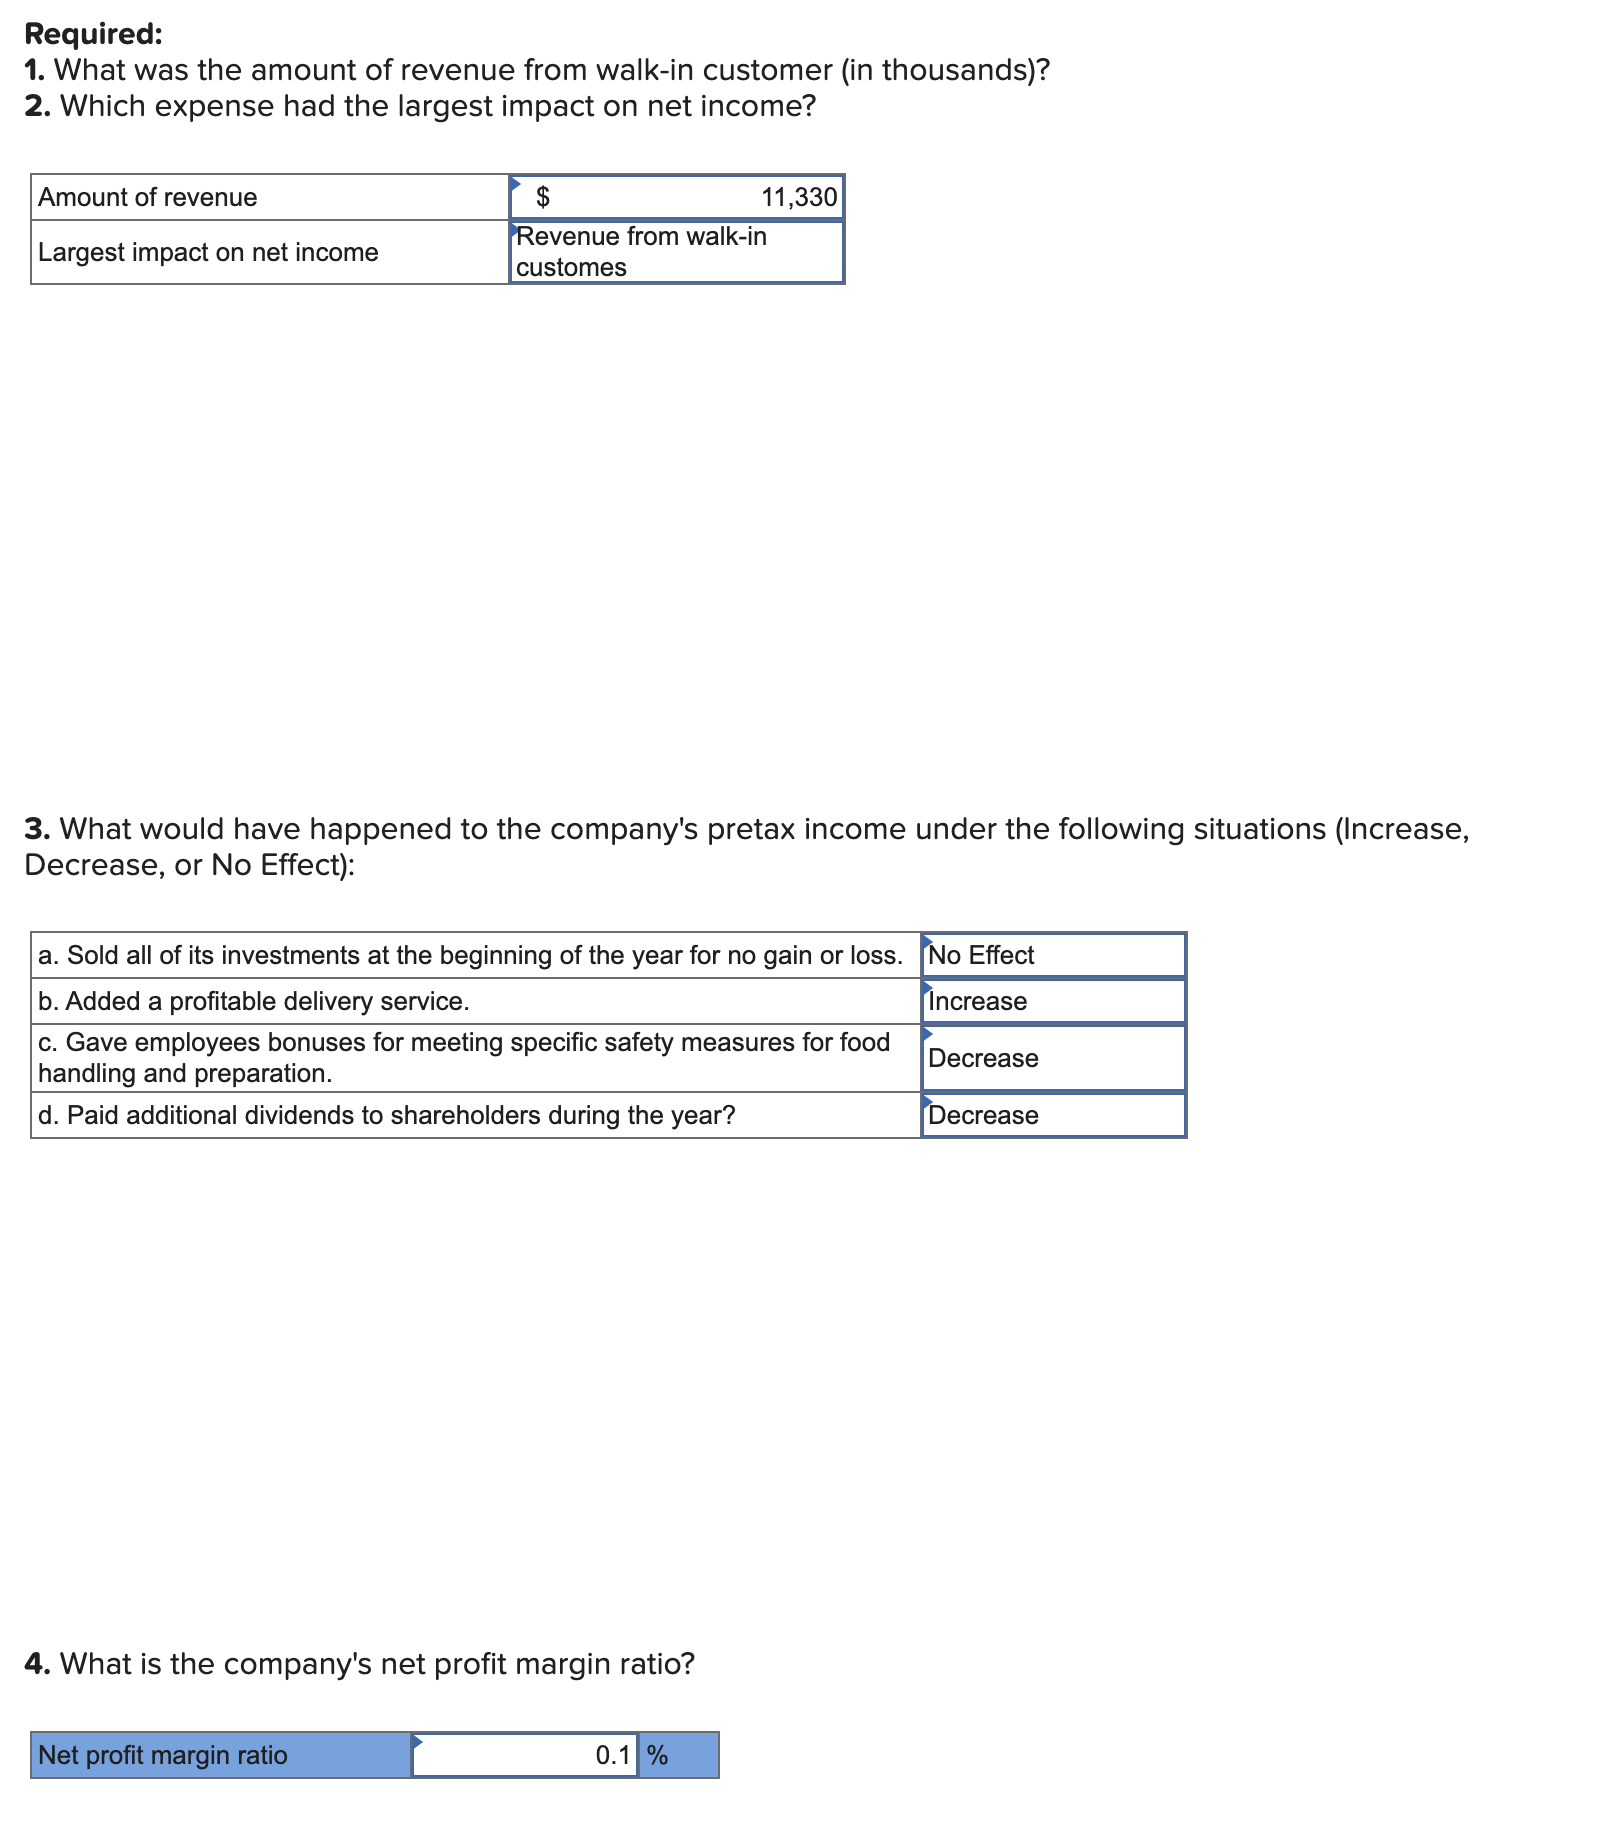
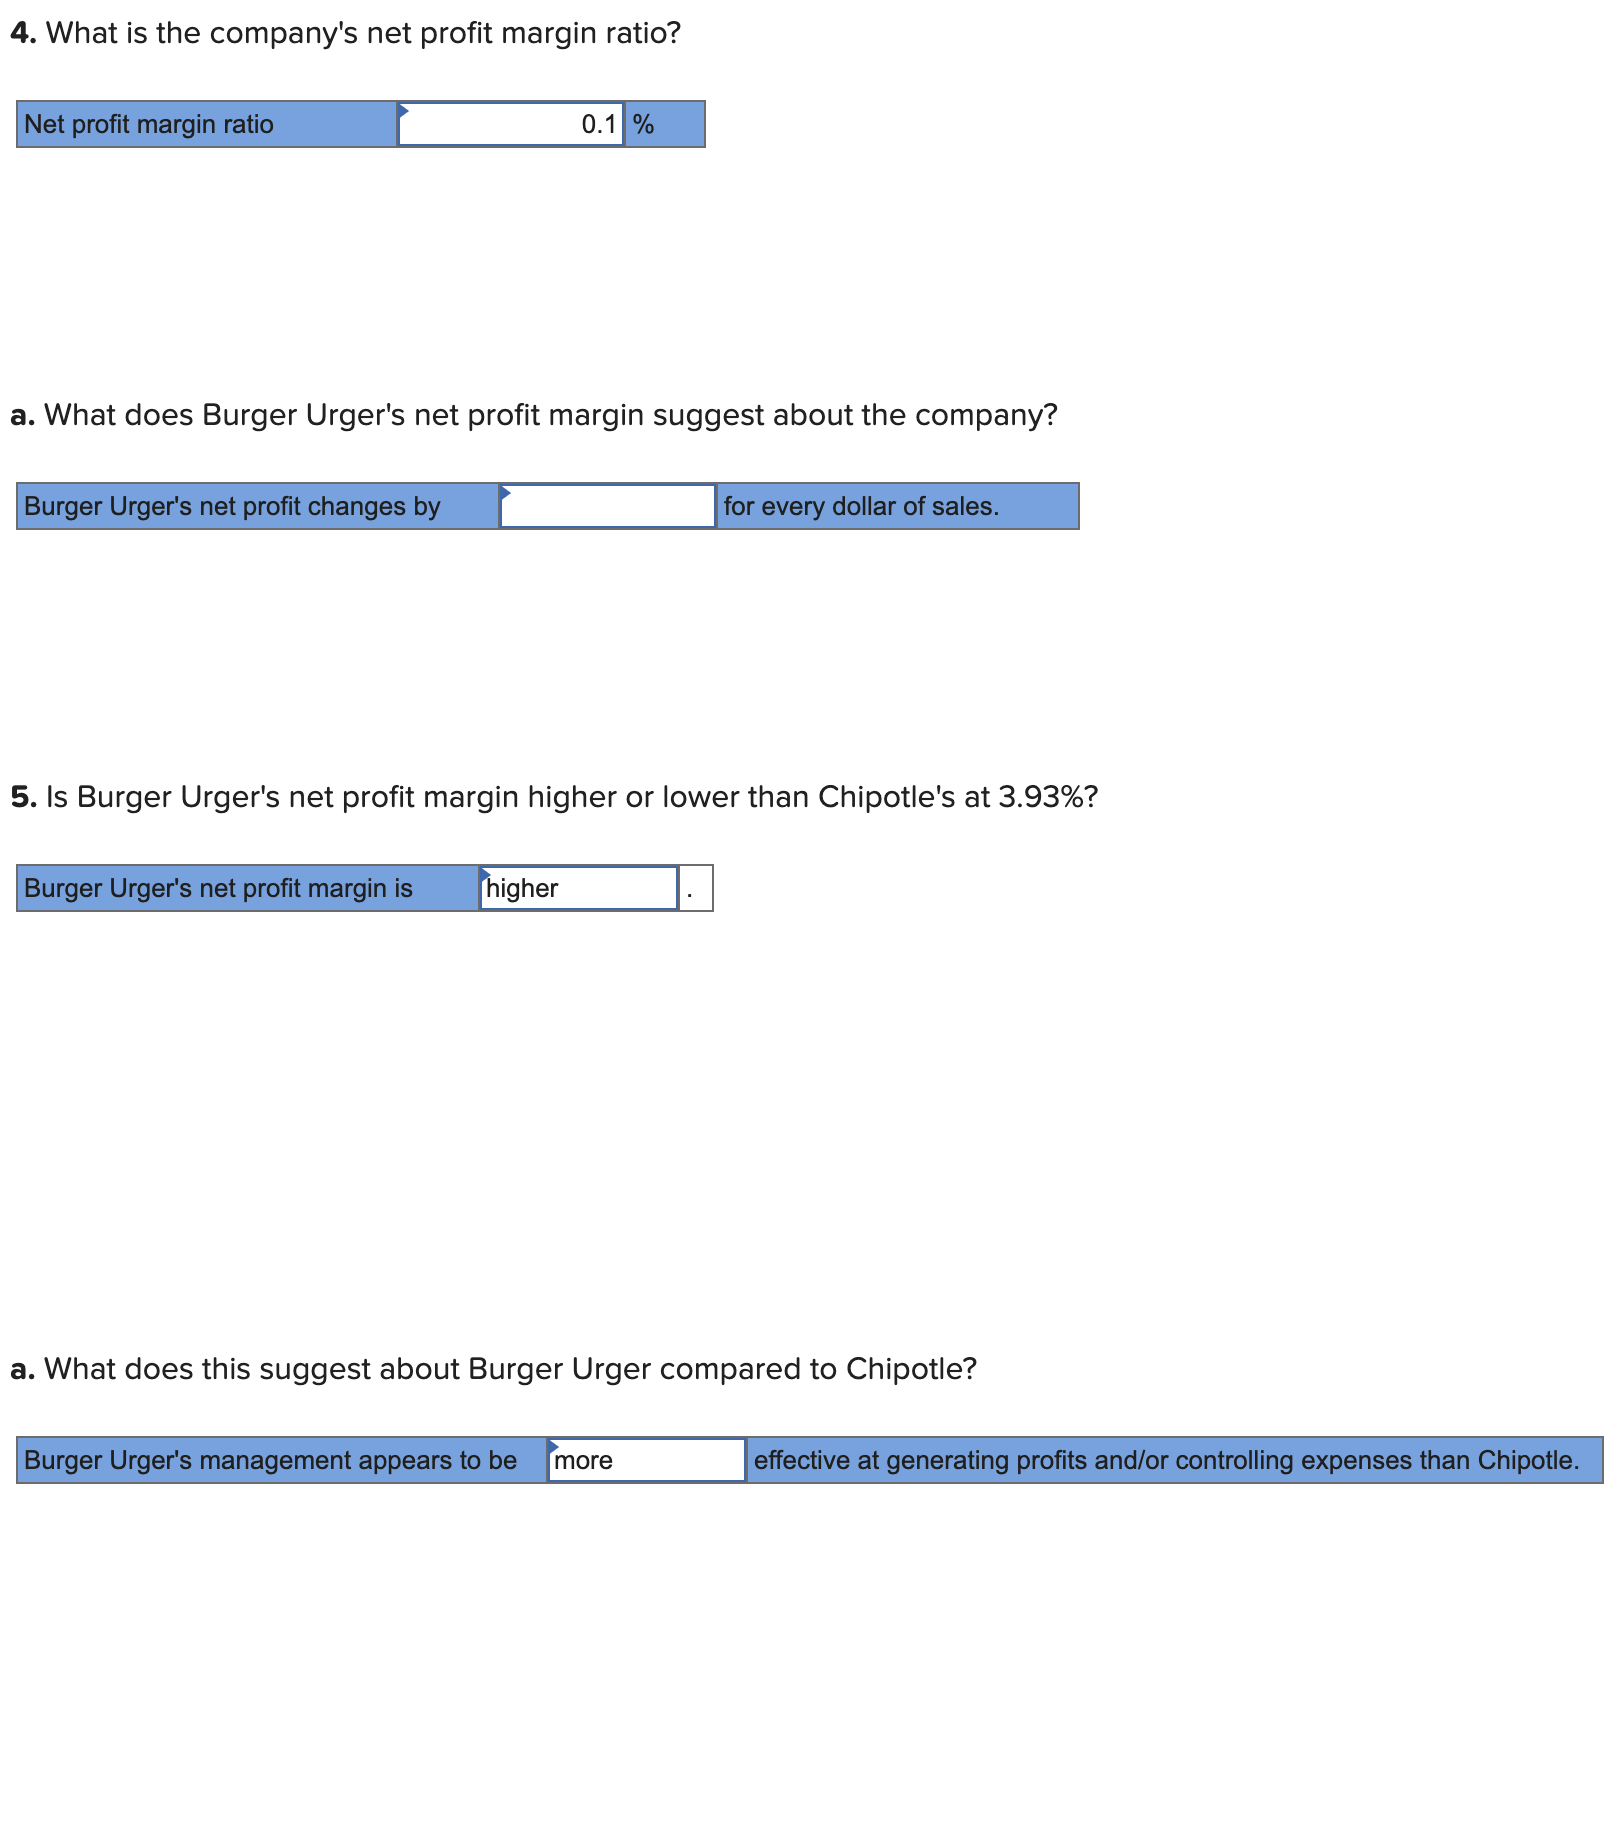 Tableau Dashboard Activity 3-1 Analyzing Income Statement Items and Net Profit Margin Use the controls on the right to manipulate the Tableau visualization to answer the questions that follow. Information for Burger Urger, Incorporated, a fast food restaurant, is presented in the waterfall charts on a Tableau Dashboard. Waterfall charts draw attention to factors that cause differences between amounts, such as the increase or decrease in a company's net income from last year to this year. Use the information in the charts to answer the following questions. Dollars are in thousands. Revenues appear in blue and are shown as negative values in the tooltips. Expenses appear in red and are shown as positive values in the tooltips. All answers should be entered as positive numbers. Information on This Year's Net Income Required: 1. What was the amount of revenue from walk-in customer (in thousands)? 2. Which expense had the largest impact on net income? 3. What would have happened to the company's pretax income under the following situations (Increase, Decrease, or No Effect): 4. What is the company's net profit margin ratio? 4. What is the company's net profit margin ratio? a. What does Burger Urger's net profit margin suggest about the company? 5. Is Burger Urger's net profit margin higher or lower than Chipotle's at 3.93\%? a. What does this suggest about Burger Urger compared to Chipotle? Tableau Dashboard Activity 3-1 Analyzing Income Statement Items and Net Profit Margin Use the controls on the right to manipulate the Tableau visualization to answer the questions that follow. Information for Burger Urger, Incorporated, a fast food restaurant, is presented in the waterfall charts on a Tableau Dashboard. Waterfall charts draw attention to factors that cause differences between amounts, such as the increase or decrease in a company's net income from last year to this year. Use the information in the charts to answer the following questions. Dollars are in thousands. Revenues appear in blue and are shown as negative values in the tooltips. Expenses appear in red and are shown as positive values in the tooltips. All answers should be entered as positive numbers. Information on This Year's Net Income Required: 1. What was the amount of revenue from walk-in customer (in thousands)? 2. Which expense had the largest impact on net income? 3. What would have happened to the company's pretax income under the following situations (Increase, Decrease, or No Effect): 4. What is the company's net profit margin ratio? 4. What is the company's net profit margin ratio? a. What does Burger Urger's net profit margin suggest about the company? 5. Is Burger Urger's net profit margin higher or lower than Chipotle's at 3.93\%? a. What does this suggest about Burger Urger compared to Chipotle
 Step by Step Solution
There are 3 Steps involved in it
Step: 1

Get Instant Access to Expert-Tailored Solutions
See step-by-step solutions with expert insights and AI powered tools for academic success
Step: 2

Step: 3
Ace Your Homework with AI
Get the answers you need in no time with our AI-driven, step-by-step assistance
Get Started
Ethics In Finance
Authors: John R. Boatright
3rd Edition
1118615824, 978-1118615829