
 Tables:
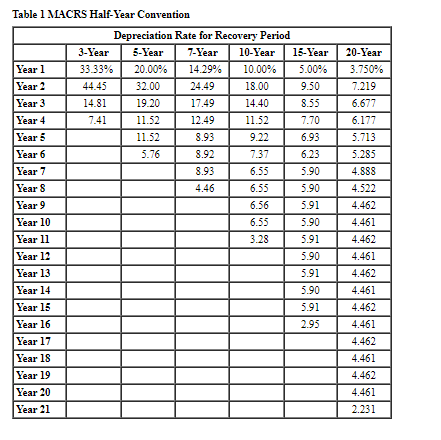
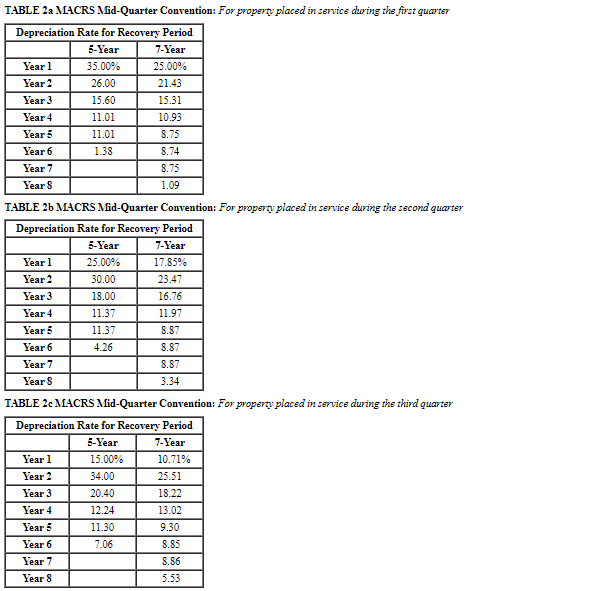
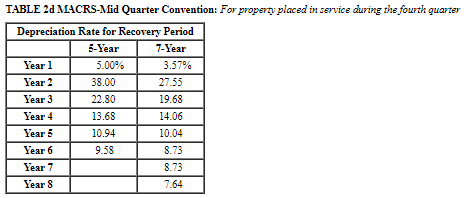
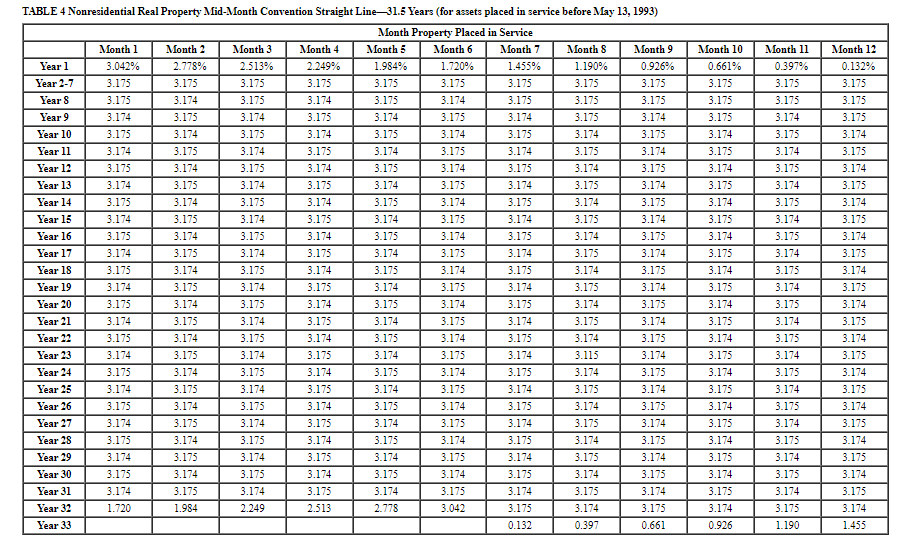
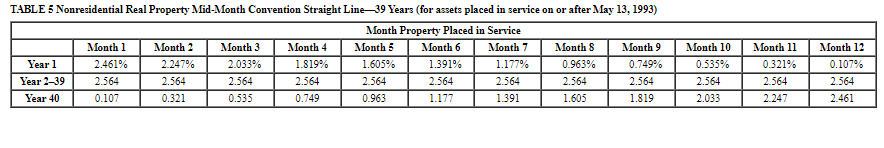
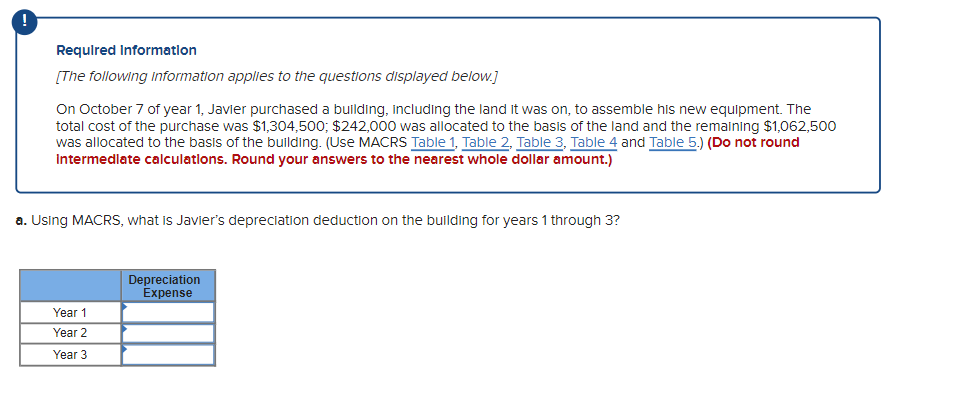
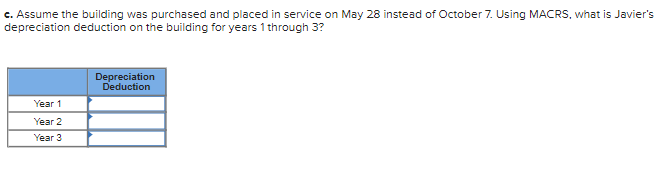
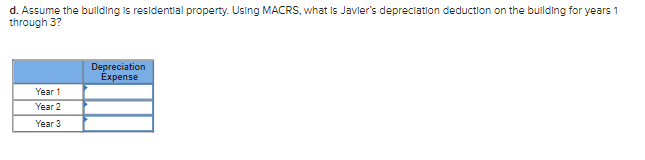
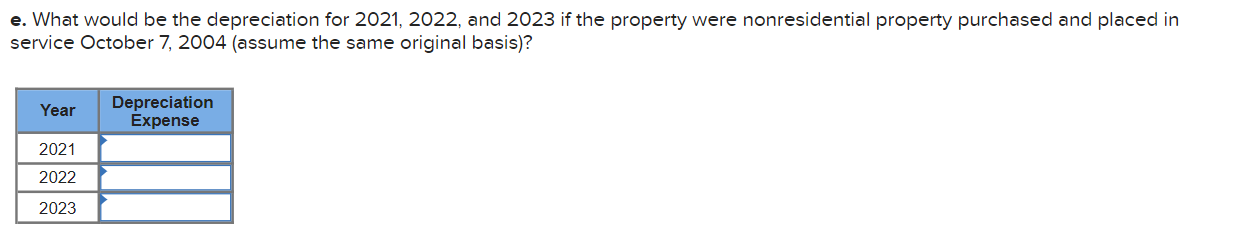
Required Information [The following information applies to the questions displayed below.] On October 7 of year 1, Javier purchased a building, including the land it was on, to assemble his new equipment. The total cost of the purchase was $1,304,500; $242,000 was allocated to the basis of the land and the remaining $1,062,500 was allocated to the basis of the building. (Use MACRS Table 1, Table 2, Table 3, Table 4 and Table 5.) (Do not round Intermediate calculations. Round your answers to the nearest whole dollar amount.) a. Using MACRS, what is Javier's depreciation deduction on the building for years 1 through 3? www Year 1 Year 2 Year 3 Depreciation Expense b. What would be the year 3 depreciation deduction if the building was sold on May 12 of year 3? Year 3 depreciation deduction c. Assume the building was purchased and placed in service on May 28 instead of October 7. Using MACRS, what is Javier's depreciation deduction on the building for years 1 through 3? Year 1 Year 2 Year 3 Depreciation Deduction d. Assume the building is residential property. Using MACRS, what is Javier's depreciation deduction on the building for years 1 through 3? Year 1 Year 2 Year 3 Depreciation Expense e. What would be the depreciation for 2021, 2022, and 2023 if the property were nonresidential property purchased and placed in service October 7, 2004 (assume the same original basis)? Year 2021 2022 2023 Depreciation Expense Table 1 MACRS Half-Year Convention Year 1 Year 2 Year 3 Year 4 Year 5 Year 6 Year 7 Year 8 Year 9 Year 10 Year 11 Year 12 Year 13 Year 14 Year 15 Year 16 Year 17 Year 18 Year 19 Year 20 Year 21 Depreciation Rate for Recovery Period 3-Year 5-Year 7-Year 10-Year 15-Year 20.00% 14.29% 10.00% 5.00% 32.00 18.00 9.50 19.20 14.40 8.55 11.52 7.70 9.22 6.93 6.23 5.90 5.90 5.91 5.90 5.91 5.90 5.91 5.90 5.91 2.95 33.33% 44.45 14.81 7.41 11.52 11.52 5.76 24.49 17.49 12.49 8.93 8.92 8.93 4.46 7.37 6.55 6.55 6.56 6.55 3.28 20-Year 3.750% 7.219 6.677 6.177 5.713 5.285 4.888 4.522 4.462 4.461 4.462 4.461 4.462 4.461 4.462 4.461 4.462 4.461 4.462 4.461 2.231 TABLE 2a MACRS Mid-Quarter Convention: For property placed in service during the first quarter Depreciation Rate for Recovery Period 5-Year 7-Year 35.00% 25.00% 26.00 21.43 15.60 15.31 11.01 10.93 11.01 8.75 1.38 8.74 8.75 1.09 Year 1 Year 2 Year 3 Year 4 Year 5 Year 6 Year 7 Year 8 TABLE 26 MACRS Mid-Quarter Convention: For property placed in service during the second quarter Depreciation Rate for Recovery Period 5-Year 7-Year 25.00% 17.85% 30.00 23.47 18.00 11.37 11.37 4.26 Year 1 Year 2 Year 3 Year 4 Year 5 Year 6 Year 7 Year 8 16.76 11.97 8.87 8.87 8.87 3.34 TABLE 2c MACRS Mid-Quarter Convention: For property placed in service during the third quarter Depreciation Rate for Recovery Period 5-Year 7-Year 15.00% 10.71% 34.00 25.51 20.40 18.22 12.24 13.02 11.30 7.06 Year 1 Year 2 Year 3 Year 4 Year 5 Year 6 Year 7 Year 8 9.30 8.85 8.86 5.53 TABLE 2d MACRS-Mid Quarter Convention: For property placed in service during the fourth quarter Depreciation Rate for Recovery Period 5-Year 7-Year Year 1 Year 2 Year 3 Year 4 Year 5 Year 6 Year 7 Year 8 5.00% 38.00 22.80 13.68 10.94 9.58 3.57% 27.55 19.68 14.06 10.04 8.73 8.73 7.64 TABLE 3 Residential Rental Property Mid-Month Convention Straight Line-27.5 Years Month Property Placed in Service Month 6 Month 7 Month 5 Year 1 Year 2-9 Year 10 Year 11 Year 12 Year 13 Year 14 Year 15 Year 16 Year 17 Year 18 Year 19 Year 20 Year 21 Year 22 Year 23 Year 24 Year 25 Year 26 Year 27 Year 28 Year 29 Month 1 Month 2 3.485% 3.182% 3.636 3.636 3.637 3.636 3.637 3.636 3.637 3.636 3.637 3.636 3.637 3.636 3.637 3.636 3.637 3.636 3.637 3.636 3.637 3.636 1.97 3.637 3.636 3.637 3.636 3.637 3.636 3.637 3.636 3.637 3.636 3.637 3.636 3.637 3.636 3.637 3.636 3.637 3.636 2.273 Month 3 2.879% 3.636 3.637 3.636 3.637 3.636 3.637 3.636 3.637 3.636 3.637 3.636 3.637 3.636 3.637 3.636 3.637 3.636 3.637 3.636 2.576 Month 4 2.576% 3.636 3.637 3.636 3.637 3.636 3.637 3.636 3.637 2.273% 3.636 3.637 3.636 3.637 3.636 3.637 3.637 3.636 3.637 3.636 2.879 1.970% 3.636 3.637 3.636 3.637 3.636 3.637 3.636 3.637 3.636 3.636 3.637 3.637 3.636 3.636 3.637 3.637 3.636 3.636 3.636 3.637 3.637 3.637 3.636 3.636 3.636 3.637 3.636 3.637 3.636 3.182 1.667% 3.636 3.636 3.637 3.636 3.637 3.637 3.636 3.636 3.636 3.637 3.637 3.637 3.636 3.636 3.636 3.637 3.637 3.637 3.636 3.636 3.636 3.637 3.637 3.637 3.636 3.636 3.637 3.637 3.636 3.637 3.637 3.636 3.636 3.637 3.637 3.636 3.636 3.485 Month 8 Month 9 Month 10 Month 11 Month 12 1.364% 1.061% 0.758% 0.455% 0.152% 3.636 3.636 3.636 3.636 3.636 3.636 3.636 3.636 3.636 3.636 3.637 3.637 3.637 3.637 3.636 3.636 3.636 3.637 3.637 3.637 3.636 3.636 3.636 3.636 3.637 3.637 3.637 3.637 3.636 3.636 3.636 3.636 3.637 3.637 3.637 3.637 3.636 3.636 3.636 3.637 3.637 3.637 3.636 3.636 3.636 3.637 3.637 3.637 3.636 3.636 3.636 3.636 3.637 3.637 3.637 3.636 3.636 3.637 3.636 0.152 3.637 3.636 3.636 3.637 3.637 3.636 3.637 3.637 3.636 3.636 3.637 3.636 0.758 3.637 3.636 0.455 3.637 3.636 3.637 3.636 1.061 3.636 3.637 3.636 3.637 3.636 1.364 3.636 3.637 3.636 3.637 3.636 3.637 3.636 3.637 3.636 3.637 3.636 1.667 TABLE 4 Nonresidential Real Property Mid-Month Convention Straight Line-31.5 Years (for assets placed in service before May 13, 1993) Month Property Placed in Service Month 6 Month 5 1.984% Month 7 1.455% 3.175 3.175 3.175 3.175 3.174 3.174 3.175 3.175 3.174 3.174 3.175 3.175 3.174 3.174 3.175 3.175 3.174 3.174 Year 1 Year 2-7 Year 8 Year 9 Year 10 Year 11 Year 12 Year 13 Year 14 Year 15 Year 16 Year 17 Year 18 Year 19 Year 20 Year 21 Year 22 Year 23 Year 24 Year 25 Year 26 Year 27 Year 28 Year 29 Year 30 Year 31 Year 32 Year 33 Month 1 3.042% 3.175 3.175 3.174 3.175 3.174 3.175 3.174 3.175 3.174 3.175 3.174 3.175 3.174 3.175 3.174 3.175 3.174 3.175 3.174 3.175 3.174 3.175 3.174 3.175 3.174 1.720 Month 2 2.778% 3.175 3.174 3.175 3.174 3.175 3.174 3.175 3.174 3.175 3.174 3.175 3.174 3.175 3.174 3.175 3.174 3.175 3.174 3.175 3.174 3.175 3.174 3.175 3.174 3.175 1.984 Month 3 2.513% 3.175 3.175 3.174 3.175 3.174 3.175 3.174 3.175 3.174 3.175 3.174 3.175 3.174 3.175 3.174 3.175 3.174 3.175 3.174 3.175 3.174 3.175 3.174 3.175 3.174 2.249 Month 4 2.249% 3.175 3.174 3.175 3.174 3.175 3.174 3.175 3.174 3.175 3.174 3.175 3.174 3.175 3.174 3.175 3.174 3.175 3.174 3.175 3.174 3.175 3.174 3.175 3.174 3.175 2.513 3.175 3.174 3.175 3.174 3.175 3.174 3.175 3.174 3.175 3.174 3.175 3.174 3.175 3.174 3.175 3.174 2.778 1.720% 3.175 3.174 3.175 3.174 3.175 3.174 3.175 3.174 3.175 3.174 3.175 3.174 3.175 3.174 3.175 3.174 3.175 3.174 3.175 3.174 3.175 3.174 3.175 3.174 3.175 3.042 3.175 3.174 3.175 3.174 3.175 3.174 3.175 3.174 3.175 3.174 3.175 3.174 3.175 3.174 3.175 3.174 3.175 0.132 Month 8 Month 9 1.190% 0.926% 3.175 3.175 3.175 3.175 3.174 3.175 3.174 3.175 3.174 3.175 3.174 3.175 3.174 3.175 3.174 3.175 3.174 3.115 3.174 3.175 3.174 3.175 3.174 3.175 3.174 3.175 3.174 0.397 3.175 3.174 3.175 3.174 3.175 3.174 3.175 3.174 3.175 3.174 3.175 3.174 3.175 3.174 3.175 3.174 3.175 3.174 3.175 3.174 3.175 3.174 3.175 3.174 3.175 0.661 Month 10 Month 11 0.661% 0.397% 3.175 3.175 3.175 3.175 3.175 3.174 3.174 3.175 3.175 3.174 3.174 3.175 3.174 3.175 3.174 3.175 3.174 3.175 3.174 3.175 3.174 3.175 3.174 3.175 3.174 3.175 3.174 3.175 3.174 3.175 3.174 0.926 3.175 3.174 3.175 3.174 3.175 3.174 3.175 3.174 3.175 3.174 3.175 3.174 3.175 3.174 3.175 3.174 3.175 3.174 3.175 3.174 3.175 1.190 Month 12 0.132% 3.175 3.175 3.175 3.174 3.175 3.174 3.175 3.174 3.175 3.174 3.175 3.174 3.175 3.174 3.175 3.174 3.175 3.174 3.175 3.174 3.175 3.174 3.175 3.174 3.175 3.174 1.455 TABLE 5 Nonresidential Real Property Mid-Month Convention Straight Line-39 Years (for assets placed in service on or after May 13, 1993) Month Property Placed in Service Month 5 1.605% Month 6 1.391% Month 7 1.177% 2.564 2.564 2.564 0.963 1.177 1.391 Year 1 Year 2-39 Year 40 Month 1 2.461% 2.564 0.107 Month 2 2.247% 2.564 0.321 Month 3 2.033% 2.564 0.535 Month 4 1.819% 2.564 0.749 Month 8 0.963% 2.564 1.605 Month 9 0.749% 2.564 1.819 Month 10 0.535% 2.564 2.033 Month 11 0.321% 2.564 2.247 Month 12 0.107% 2.564 2.461


