Answered step by step
Verified Expert Solution
Link Copied!

Question

1 Approved Answer

table[[Step,Instructions,table[[Points],[Possible]]],[1,table[[Start Excel. Open the file named e02_grader_hw_B-Trendz.xIsx. Save the file with the name],[e02_grader_hw_B-Trendz_LastFirst, replacing Lastifirstwith your last and first name.]],0],[2,table[[On the Retail worksheet, in cells

\\\\table[[Step,Instructions,\\\\table[[Points],[Possible]]],[1,\\\\table[[Start Excel. Open the file named e02_grader_hw_B-Trendz.xIsx. Save the file with the name],[e02_grader_hw_B-Trendz_LastFirst, replacing Lastifirstwith your last and first name.]],0],[2,\\\\table[[On the Retail worksheet, in cells B17:E17 calculate the quarterly sales totals for the women's],[clothing line. In cells B33:E33 calculate the quarterly sales totals for the men's clothing line.]],4],[3,\\\\table[[In cells F5:F17, calculate the yearly sales totals for the women's clothing line. In cells F21:F33,],[calculate the yearly sales totals for the men's clothing line. In B36:F36, calculate the grand],[totals of women's and men's clothing sales.]],5],[4,\\\\table[[In B37:E37, calculate the percentage of sales from women's clothing. Format as Percentage],[and display zero decimal places. In B38:E38, calculate the percentage of sales from men's],[clothing. Format as Percentage and display zero decimal places.]],4],[5,\\\\table[[You have been asked to determine whether the grand total yearly sales goals were met.],[The 2018 yearly sales goals were met if the yearly sales were

$25,000,000

or more. In cell],[G36, using a logical function, determine whether the yearly sales goals were met. Set the],[formula to return a value of Yes if the goal was met or a value of No if the goal was not met.]],5],[6,\\\\table[[You want to create quick visuals of the quarterly sales of each product line, so you decide to],[use Sparklines to view the sales at a glance. In G5:G16, insert Line Sparklines based on the],[data in B5:E16. Add High Point markers. Also add Line Sparklines for the Men's clothing data],[in G21:G32 based on data in B21:E32. Add High Point markers.]],3]]
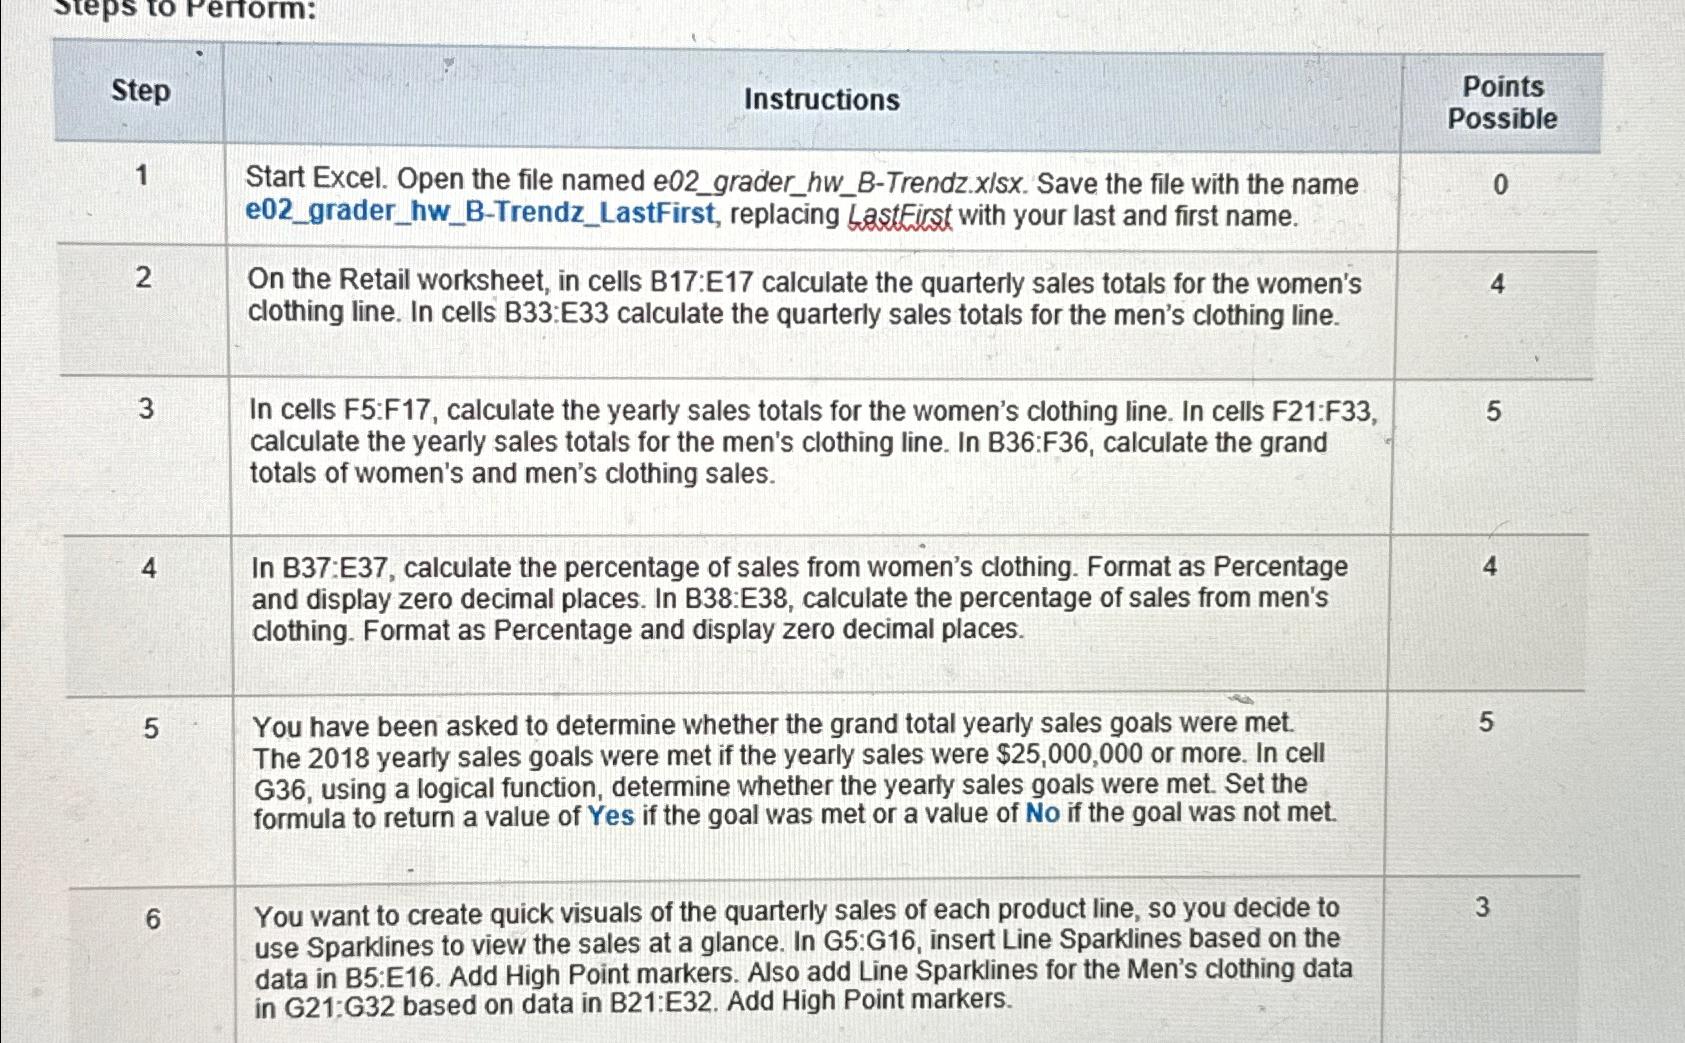
image text in transcribed
\begin{tabular}{|c|c|c|} \hline Step & Instructions & \begin{tabular}{l} Points \\ Possible \end{tabular} \\ \hline 1 & \begin{tabular}{l} Start Excel. Open the file named e02_grader_hw_B-Trendz.xIsx. Save the file with the name \\ e02_grader_hw_B-Trendz_LastFirst, replacing LastFirstwith your last and first name. \end{tabular} & 0 \\ \hline 2 & \begin{tabular}{l} On the Retail worksheet, in cells B17:E17 calculate the quarterly sales totals for the women's \\ clothing line. In cells B33:E33 calculate the quarterly sales totals for the men's clothing line. \end{tabular} & 4 \\ \hline 3 & \begin{tabular}{l} In cells F5:F17, calculate the yearly sales totals for the women's clothing line. In cells F21:F33, \\ calculate the yearly sales totals for the men's clothing line. In B36:F36, calculate the grand \\ totals of women's and men's clothing sales. \end{tabular} & 5 \\ \hline 4 & \begin{tabular}{l} In B37:E37, calculate the percentage of sales from women's clothing. Format as Percentage \\ and display zero decimal places. In B38:E38, calculate the percentage of sales from men's \\ clothing. Format as Percentage and display zero decimal places. \end{tabular} & 4 \\ \hline 5 & \begin{tabular}{l} You have been asked to determine whether the grand total yearly sales goals were met. \\ The 2018 yearly sales goals were met if the yearly sales were $25,000,000 or more. In cell \\ G36, using a logical function, determine whether the yearly sales goals were met. Set the \\ formula to return a value of Yes if the goal was met or a value of No if the goal was not met. \end{tabular} & 5 \\ \hline 6 & \begin{tabular}{l} You want to create quick visuals of the quarterly sales of each product line, so you decide to \\ use Sparklines to view the sales at a glance. In G5:G16, insert Line Sparklines based on the \\ data in B5:E16. Add High Point markers. Also add Line Sparklines for the Men's clothing data \\ in G21:G32 based on data in B21:E32. Add High Point markers. \end{tabular} & 3 \\ \hline \end{tabular}

Step by Step Solution

There are 3 Steps involved in it

Step: 1

blur-text-image

Get Instant Access to Expert-Tailored Solutions

See step-by-step solutions with expert insights and AI powered tools for academic success

Step: 2

blur-text-image_2

Step: 3

blur-text-image_3

Ace Your Homework with AI

Get the answers you need in no time with our AI-driven, step-by-step assistance

Get Started

Recommended Textbook for

Advances In Knowledge Discovery In Databases

Authors: Animesh Adhikari, Jhimli Adhikari

1st Edition

3319132121, 9783319132129

More Books

Students also viewed these Databases questions