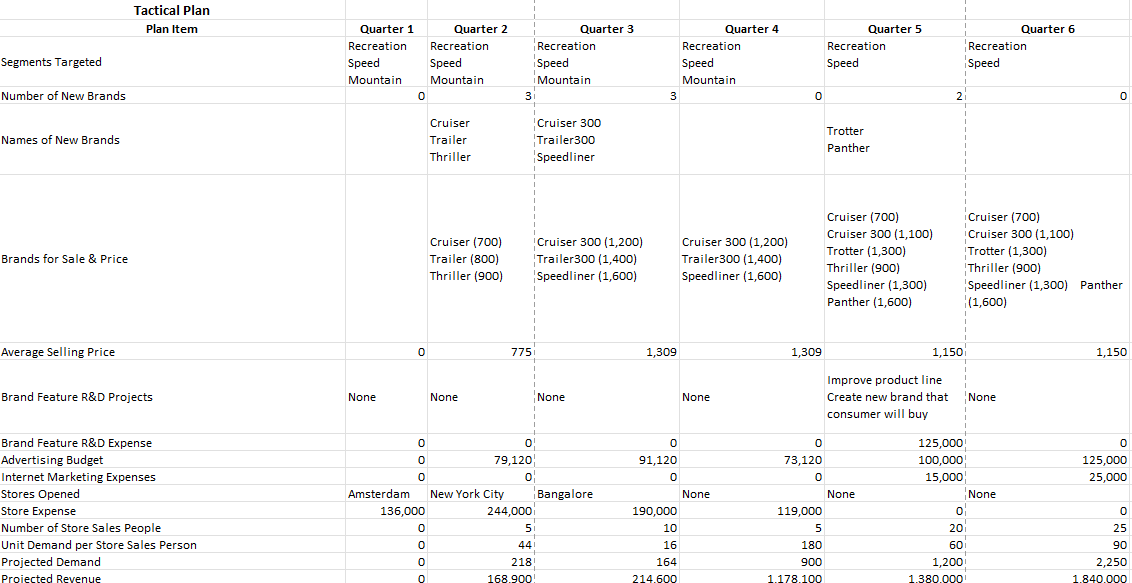
Tactical Plan Plan Item Quarter 1 Quarter 2 Quarter 3 Quarter 4 Quarter 5 Quarter 6 Recreation Recreation Recreation Recreation Recreation Recreation Segments Targeted Speed Speed iSpeed Speed Speed Speed Mountain Mountain i Mountain Mountain Number of New Brands 0 3 3 2 0 Cruiser Cruiser 300 Trotter Names of New Brands Trailer Trailer300 Panther Thriller Speedliner Cruiser (700) Cruiser (700) Cruiser 300 (1,100) Cruiser (700) Cruiser 300 (1,200) Cruiser 300 (1,200) Cruiser 300 (1,100) Trailer (800) |Trailer300 (1,400) Trailer300 (1,400) Trotter (1,300) ITrotter (1,300) Brands for Sale & Price Thriller (900) Thriller (900) Thriller (900) Speedliner (1,600) Speedliner (1,600) Speedliner (1,300) Speedliner (1,300) Panther Panther (1,600) (1,600) Average Selling Price 775 1,309 1,309 1,150 1,150 Improve product line Brand Feature R&D Projects None None None None Create new brand that None consumer will buy Brand Feature R&D Expense O 0 0 0 125,000 Advertising Budget 79,120 91,120 73,120 100,000 125,000 O O Internet Marketing Expenses 0 0 0 15,000 25,000 Stores Opened Amsterdam New York City i Bangalore None None None Store Expense 136,000 244,000 190,000 119,000 0 0 Number of Store Sales People 5 10 5 20 25 Unit Demand per Store Sales Person 44 16 180 60 90 O O Projected Demand 218 164 900 1,200 2,250 rojected Reveni 168.900 214.600 .178.100 1.380.000 1.840.00018 Cost of Goods Sold 92,770 66,008 537,600 716,800 19 Production Worker Compensation 11,859 11,859 11,859 27,000 29,000 20 Production Supervisor Compensation 17,297 17,297 17,297 32,000 35,000 21 Average Sales Person Compensation 20,834 20,834 20,834 30,000 32,000 22 Sales Force Salaries 26,043 52,086 26,043 600,000 800,000 23 Total Sales Force Expense 29,567 55,610 27,669 18,000 21,000 24 Addition to Fixed Capacity 16 24 16 48 64 25 Investment in Fixed Capacity 480,000 720,000 480,000 0 720,000 1,000,000 26 Available Fixed Capacity 0 1,040 2,600 3,640 1,560 3,120 27 Operating Capacity 0 650 845 1,200 1,365 2,530 28 Maximum Overtime per Day No overtime 1 hour 1 hour 1 hour No overtime No overtime 29 % Lost Capacity Due to Production Productivity 100 32 33 33 20 0 30 Production Volume 0 218 164 900 1,200 1,600 31 Lost Sales 0 0 0 32 Excess Capacity 226 402 0 33 Average Unit Production Cost OOO 426 402 0 448 448 34 Total Production Cost 92,770 66,008 0 537,600 716,800 35 System Improvement Actions None None None None None None 36 Total Quality Cost 38,546 10,191 O 500,000 0 Total System Improvement Costs 0 5,000 60,000 0 500,000 100,000 38 Total R&D Cost 0 90,000 90,000 0 0 39 Conventional Bank Loans 0 0 0 Oi OOO 40 Emergency Loan O O 219,519 O O O 41 Total Debt Level 0 219,519 42 Equity Investment 1,500,000 2,000,000 2,500,000 5,000,000 5,000,000 5,000,000 43 Total Assets 1,364,150 1,372,027 1,610,001 3,547,000 44


