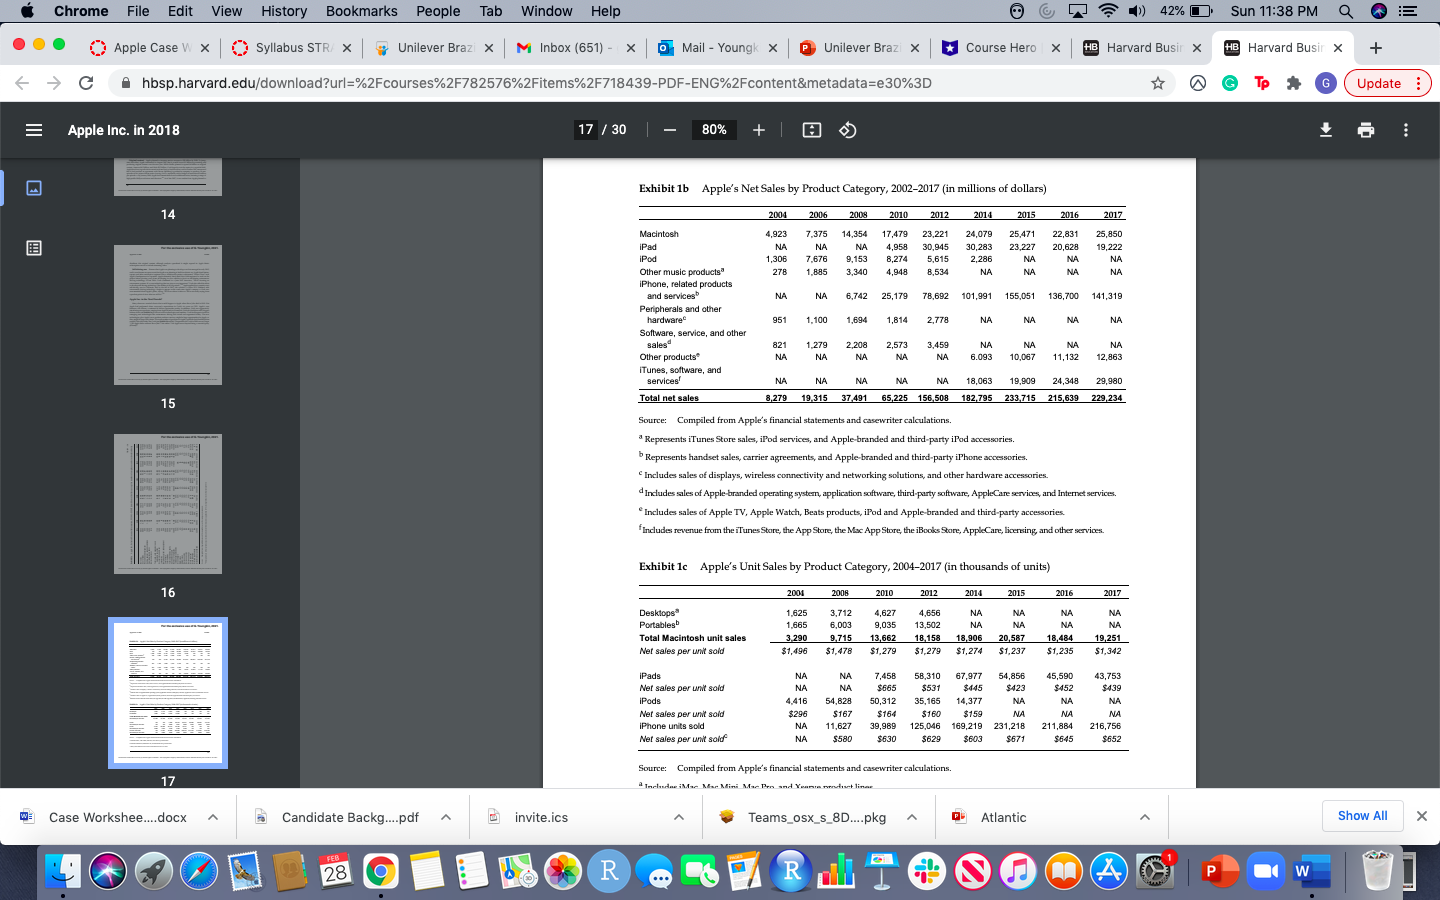
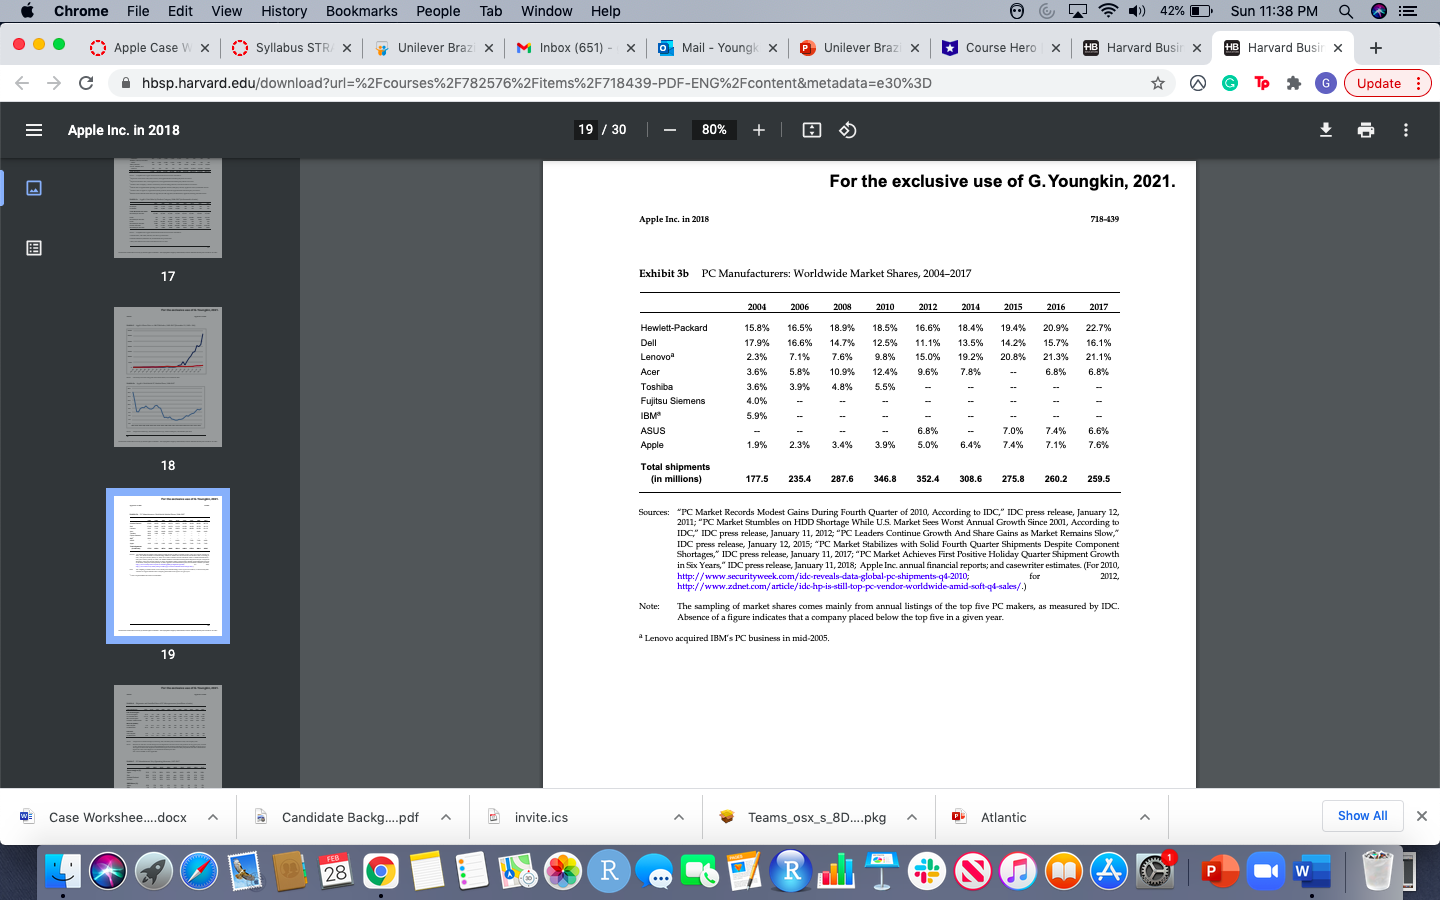
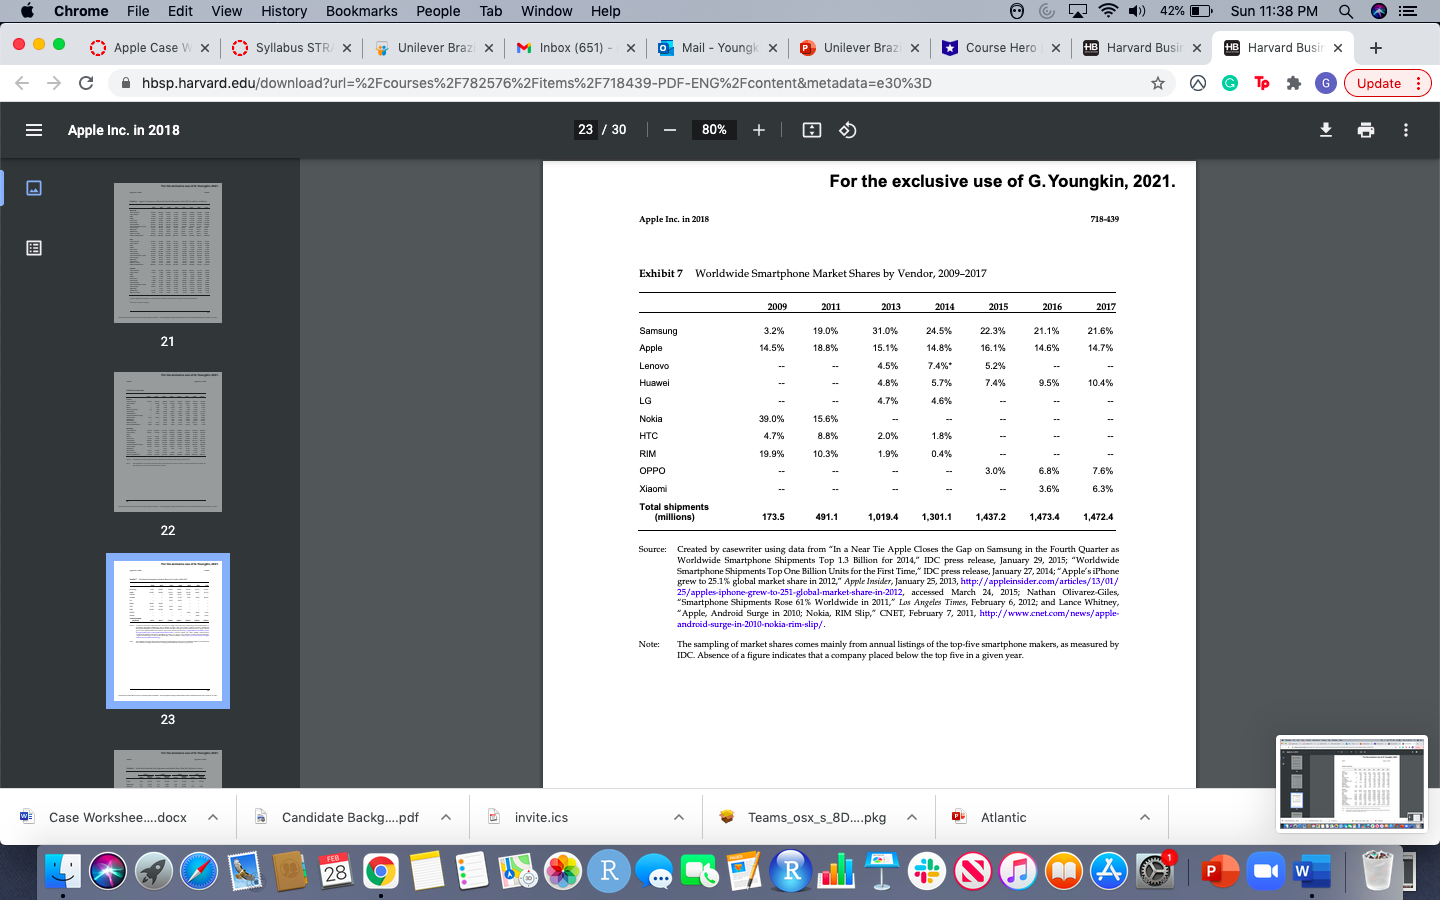
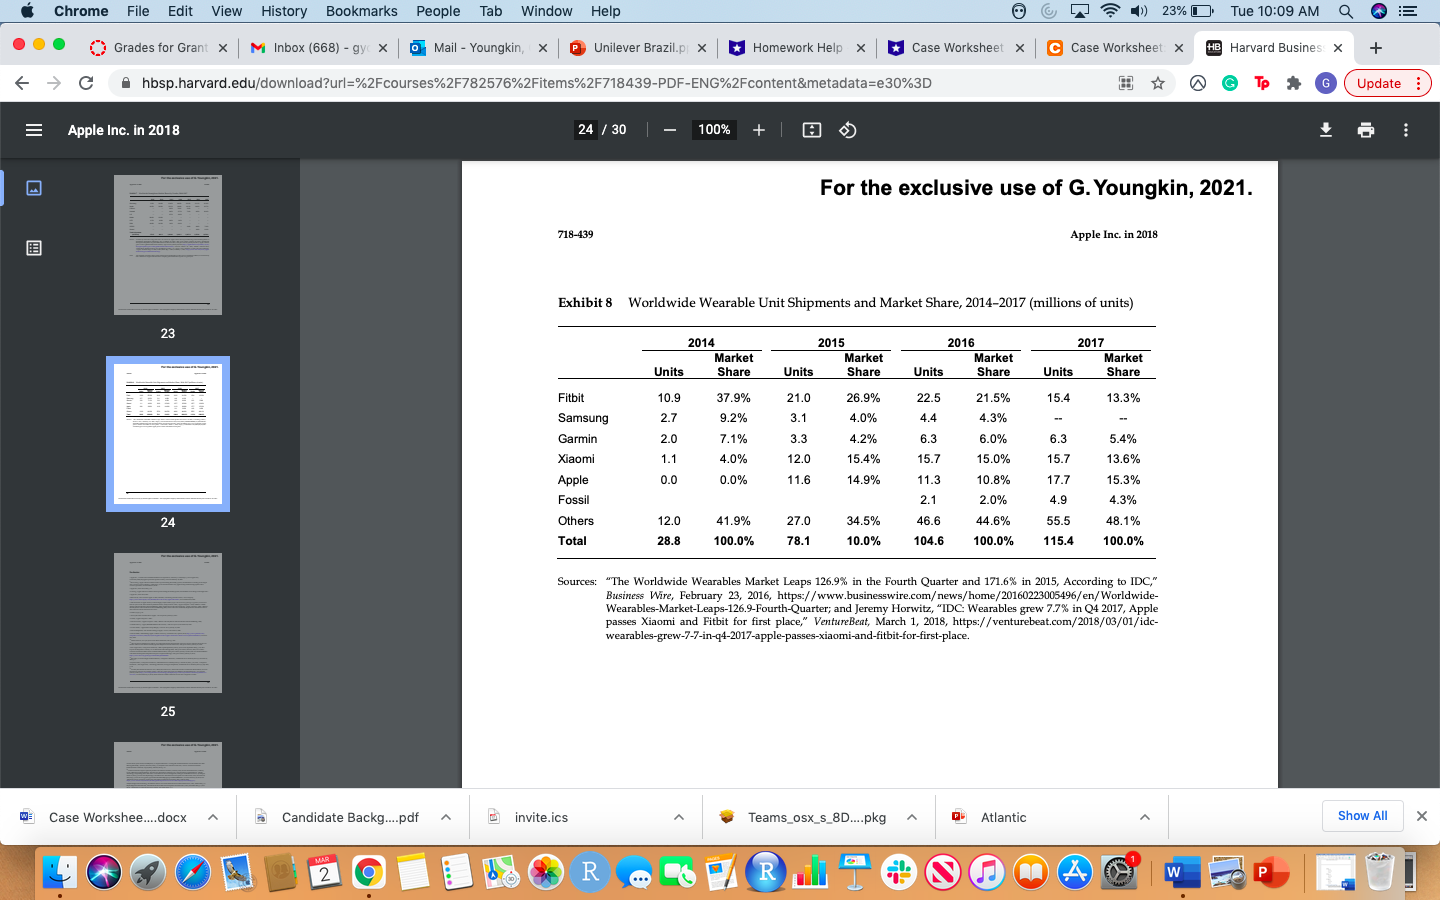
Take a close look at Exhibits 1b and 1c, which describe Apple's sales by product category.Also, look over the market share numbers in Exhibits 3b (PCs), 7 (smartphones), and 8 (wearables).For each of the time periods below, how would you prioritize Apple's major product categories in terms of the amount of focus and resources the company should devote to them?Be sure to support your answer with numbers from the case.
2004-2006:
High Priority:
Medium Priority:
Low Priority:
2010-2012:
High Priority:
Medium Priority:
Low Priority:
2017-onward:
High Priority:
Medium Priority:
Low Priority:
Chrome File Edit View History Bookmarks People Tab Window Help 7 5 7 ) 42% Sun 11:38 PM QE ... Apple Case W x Syllabus STR/ X # Unilever Brazi x M Inbox (651) - x Mail - Youngk X P Unilever Brazi X Course Hero |X HB Harvard Busir X HB Harvard Busir X + C A hosp.harvard.edu/download?url=%2Fcourses%2F782576%2Fitems%2F718439-PDF-ENG%2Fcontent&metadata=e30%3D N G TP # G Update E Apple Inc. in 2018 17 / 30 80% + Exhibit 1b Apple's Net Sales by Product Category, 2002-2017 (in millions of dollars) 14 2006 2008 2010 2012 2014 2016 2017 Macintosh 4,923 7.375 14,354 17,479 23,221 24,079 25,471 22,831 25,85 iPad NA NA NA 4,958 30,945 30.283 23 227 20.628 19.222 iPod 1,306 7.676 9,153 8,274 5.615 2.286 NA Other music products 278 1 8:85 3.340 4,948 8,534 NA NA MA iPhone, related products and services NA NA 6,742 25,179 78,692 101,991 155,051 136,700 141,319 Peripherals and other hardware 351 1.100 1,694 1,814 2,778 NA NA NA NA Software, service, and other sales 21 1 279 2,208 2,573 3.459 NA NA NA NA Other products NA NA MA NA 6.093 10.067 11,132 12,863 Tunes, software, and services' NA NA NA NA NA 18,063 19,909 24,348 29,980 Total net sales 279 19.315 37,491 65,225 156,508 182,795 233,715 215,639 2 229,234 15 Source: Compiled from Apple's financial statements and casewriter calculations. Represents iTunes Store sales, iPod services, and Apple-branded and third-party iPod accessories. Represents handset sales, carrier a nts, and Apple-branded and third-party iPhone accessories. Includes sales of displays, wirele and networking solutions, and other hardware accessories. d Includes sales of Apple-brand on software, third party software, AppleCare services, and Internet services. Includes sales of Apple TV, Apple Watch, Beats products, iPod and Apple-branded and third-party accessories. Includes revenue from the iTunes Store, the App Store, the Mac App Store, the iBooks Store, AppleCare, licensing, and other services. Exhibit 1c Apple's Unit Sales by Product Category, 2004-2017 (in thousands of units) 16 2010 2012 2015 2016 2017 Desktops* 1.625 3,712 4,627 4,656 NA NA NA PortablesD 1,665 6,003 9,035 13,502 NA NA NA NA - Total Macintosh unit sales 3,290 9,715 13,662 18.158 18,906 20,587 18,48 9,251 Net sales per unit sold $1,496 $1,478 $1,279 $1.279 $1.274 $1.237 $1,23 $1.342 iPads NA NA 7,458 58,310 67,977 54.856 45.590 3,753 Net sales per unit said NA NA $531 $445 $423 $452 $439 iPods 4.416 4,828 50,312 35,165 14,377 NA NA NAY Net sales per unit said $296 $167 $164 $160 $158 NA NA NA iPhone units sold NA 11,627 39.989 125,046 169,219 231.218 211,884 216.756 Net sales per unit sold- NA $580 $630 $629 $603 $671 $645 $652 Source: Compiled from Apple's financial statements and c sewriter calculations. 17 a Includes ilfar Mar Mini Mar T : Case Workshee....docx Candidate Backg...pdf A invite.ics Teams_osx_s_8D....pkg Atlantic Show All X FEB 28 R ... 4 P WChrome File Edit View History Bookmarks People Tab Window Help 7 5 7 ) 42% Sun 11:38 PM Q E ... Apple Case W x Syllabus STR/ X # Unilever Brazi x M Inbox (651) - x | Mail - Youngk X P Unilever Brazi X Course Hero |x HB Harvard Busir X HB Harvard Busir X + C A hosp.harvard.edu/download?url=%2Fcourses%2F782576%2Fitems%2F718439-PDF-ENG%2Fcontent&metadata=e30%3D TP G Update E Apple Inc. in 2018 19 / 30 80% + For the exclusive use of G. Youngkin, 2021. Apple Inc. in 2018 718-439 17 Exhibit 3b PC Manufacturers: Worldwide Market Shares, 2004-2017 2004 2006 2008 2010 2012 2014 2015 2016 2017 Hewlett-packard 15.8% 16.5% 18.9% 18.5% 16.6% 18.4% 19.4% 20.9% 22.7% Dell 17.9% 16.6% 14.74 12.5% 11.1% 13.5% 14.2% 15.7% 16.19 Lenovo 2.3% 7.1% 7.6% 9.8% 15.0% 19.2% 20.8% 21.3% 21.19% Acer 3.6% 5.8% 10.9% 12.4% 9.6% 7.8% 6.8% 6.8% Toshiba 3.6% 4.8% 5.5% Fujitsu Siemens 4.0% IBM 5.9% ASUS 6.8% 7.0% 74 6.67 Apple 1 9% 2.3% 3.4% 3 90% 5.0% 54% 7.4% 7.1% 7.6% 18 Total shipments (in millions) 177.5 235.4 287.6 346.8 352.4 308.6 275.8 260.2 259.5 Sources: "PC Market Records Modest Gains During Fourth Quarter of 2010, According to IDC," IDC press release, January 12, 2011; "PC Market Stumbles on HDD Shortage While U.S. Market Sees Worst Annual Growth Since 2001, According to IDC," IDC press release, January 11, 2012; "F d Share Gains as Market Remains Slow," IDC press release, January 12, 2015; "PC Market Stabilizes with Solid Fourth Quarter Shipments Despite Component ages," IDC press release, January 11, 2017; "PC Market Achieves First Positive Holiday Quarter Shipment Growth in Six Years," IDC press release, January 11, 2018; Apple Inc. annual financial reports; and casewriter estimates. (For 2010, http://www.securityweek.com/ide-reveals-data global-pc-shipments-q4-2010; fo 2012. http://www.zdnet.com/ article/ide-hp-is still-top-po-vendor-worldwide-amid-soft-q4-sales/.) Note: The sampling of market shares comes mainly from annual listings of the top five PC makers, as measured by IDC. Absence of a figure indicates that a company placed below the top five in a given year. Lenovo acquired IBM's PC business in mid-2005. 19 = Case Workshee....docx A Candidate Backg...pdf A invite.ics Teams_osx_s_8D....pkg A Atlantic Show All X FEB 28 R ... A P WChrome File Edit View History Bookmarks People Tab Window Help 7 5 7 ) 42% Sun 11:38 PM Q E ... Apple Case W x | Syllabus STR/ X # Unilever Brazi x M Inbox (651) - X Mail - Youngk X P Unilever Brazi X Course Hero |X HB Harvard Busir X HB Harvard Busir X + C hosp.harvard.edu/download?url=%2Fcourses%2F782576%2Fitems%2F718439-PDF-ENG%2Fcontent&metadata=e30%3D TP G Update E Apple Inc. in 2018 23 / 30 80% + For the exclusive use of G. Youngkin, 2021. Apple Inc. in 2018 718-439 Exhibit 7 Worldwide Smartphone Market Shares by Vendor, 2009-2017 2009 2011 2013 2014 2015 2016 2017 Samsung 3.2% 19.0% 31.0%% 24.5% 22.3% 21.1% 21.6% 21 Apple 4.5% 18.89 15.1% 14.8%% 16.1% 14.6% 14.7% Lenovo 4.5% 7.4%* 5.2% Huawei 4.8% 6.7% 9.5% 10.4% LG 4.7% 4.6% Nokia 19.0% 15.69 HTC 4.7% 8.8% 2.0% 1.8% RIM 19.9% 0.3% 19% 0.4% OPPO 3.0% 6.8% 7.6% Xiaomi 3.6% 6.3% Total shipments (millions) 173.5 491.1 1,019.4 1,301.1 1,437.2 1,473.4 1,472.4 22 Source: Created by casewriter using data from "In a Near Tie Apple Closes the Gap on Samsung in the Fourth Quarter as Worldwide Smartphone Shipments Top 1.3 Billion for 2014," IDC press release, January 29, 2015; "Worldwide - Smartphone Shipments Top One Billion Units for the First Time," IDC press release, January 27, 2014; "Apple's iPhone grew to 25.1% global market share in 2012," Apple Insider, January 25, 2013, http://appleinsider.com/articles/13/01/ 25/apples-iphone-grew-to-251-global-market-share-in-2012, accessed March 24, 2015; Nathan Olivarez-Giles, "Smartphone Shipments Rose 61% Worldwide in 2011," Los Angeles Times, February 6, 2012; and Lance Whitney, "Apple, Android Surge in 2010; Nokia, RIM Slip," CNET, February 7, 2011, http:/ /www.cnet.com/ news/apple- android-surge-in-2010-nokia-rim-slip/. Note: The sampling of market shares comes mainly from annual listings of the top five smartphone makers, as measured by IDC. Absence of a figure indicates that a company placed below the top five in a given year. 23 = Case Workshee....docx Candidate Backg...pdf A invite.ics Teams_osX_s_8D....pkg Atlantic FEB 28 R ... Rull TG A P WChrome File Edit View History Bookmarks People Tab Window Help 6 7 ) 23% Tue 10:09 AM QE ... Grades for Grant x M Inbox (668) - gy x o Mail - Youngkin, x P Unilever Brazil.p x Homework Help x Case Worksheet x C Case Worksheet: X HB Harvard Business X + C A hosp.harvard.edu/download?url=%2Fcourses%2F782576%2Fitems%2F718439-PDF-ENG%2Fcontent&metadata=e30%3D Q GTP # G Update E Apple Inc. in 2018 24 / 30 100% + For the exclusive use of G. Youngkin, 2021. 718-439 Apple Inc. in 2018 Exhibit 8 Worldwide Wearable Unit Shipments and Market Share, 2014-2017 (millions of units) 23 2014 2015 2016 2017 Market Market Market Market Units Share Units Share Units Share Units Share Fitbit 10.9 37.9% 21.0 26.9% 22.5 21.5% 15.4 13.3% Samsung 2.7 9.2% 3.1 4.0% 4.4 4.3% Garmin 2.0 7.1% 3.3 4.2% 6.3 6.0% 6.3 5.4% Xiaomi 1.1 4.0% 12.0 15.4% 15.7 15.0% 15.7 13.6% Apple 0.0 0.0% 11.6 14.9% 11.3 10.8% 17.7 15.3% Fossil 2.1 2.0% 4.9 4.3% 12.0 41.9% 27.0 34.5% .6.6 44.6% 55.5 48.1% 24 Others Total 28.8 100.0% 78.1 10.0% 104.6 100.0% 115.4 100.0% Sources: "The Worldwide Wearables Market Leaps 126.9% in the Fourth Quarter and 171.6% in 2015, According to IDC," Business Wire, February 23, 2016, https://www.businesswire.comews/home/20160223005496/en/Worldwide- Wearables-Market-Leaps-126.9-Fourth-Quarter; and Jeremy Horwitz, "IDC: Wearables grew 7.7% in Q4 2017, Apple passes Xiaomi and Fitbit for first place," VentureBeat, March 1, 2018, https://venturebeat.com/2018/03/01/idc- wearables-grew-7-7-in-q4-2017-apple-passes-xiaomi-and-fitbit-for-first-place. 25 Teams_osx_s_8D....pkg A Atlantic Show All X : Case Workshee....docx A Candidate Backg...pdf A invite.ics MAR R W P 2


