Question
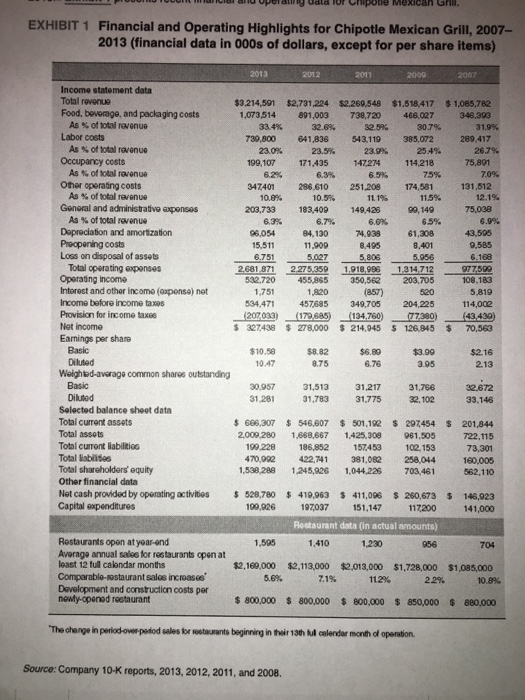
Take a close look at the data presented in case Exhibit 1 and work on the CAGR values; you should come up with some conclusions
 Take a close look at the data presented in case Exhibit 1 and work on the CAGR values; you should come up with some conclusions (complete the sentence where necessary):
 - From the end of 2007 through the end of 2013, Chipotles total revenues (decrease, increased, stay the same) at a CAGR of XXX%.
- The percentages of total revenue for the various types of operating expenses at Chipotles restaurants (all shown in Exhibit 1) indicate that shareholders should be (unhappy, pleased, concerned) with the overall operating efficiency ( decline, improvements, not showing any change) at the companys restaurants from 2007 through 2013. (Can you comment on the trend of food, beverage, and packaging costs.
- Chipotles operating income (decreased, increased, stayed the same) to $XXX million in 2013 from $XXXX in 2007, equal to a CAGR of XXXX%.
- Chipotles operating profit margin was XXX% in 2013 versus XXX% in 2012, XXX% in 2011, XXXX% in 2009, and XXXX% in 2007.
- Net income (declined, rose, was unchanged) to $XXX million in 2013 from $XXXX million in 2007, a CAGR of XXXX%.
- Chipotles net profit margin was XXX% in 2013 versus XXX% in 2012, XXX% in 2011, XXX% in 2009, and XXX% in 2007.
- EPS (declined, rose, was unchanged) to $XX per diluted share in 2013 from $XXX per diluted share in 2007, a CAGR of XXX%.
- Chipotles current ratio of XXX in 2007 (deteriorated, improved, was unchanged) to XX in 2013.
- -Net cash provided by operating activities have been (declining, rising) annually, to $XXX million in 2013 from $XXX million in 2007, a CAGR of XX%.
- Average annual sales for Chipotle restaurants open at least 12 full calendar months have (decreased, increased, unchanged), to $XXX million in 2013 from $XXXX million in 2007. This represents a CAGR of XXX%.
Comparable restaurant sales (decreases, increases) of XXX% in 2013, XXX% in 2012, XXX% in 2011, XX% in 2009, and XXX% in 2007 are certainly (not acceptable, acceptable, a disappointment).
Conclusions: Overall, since 2007 Chipotle has posted (standard, weak, strong) financial and operating results in a ho-hum economic environment. What grade would you give Chipotle for its performance? Would you consider in your grade how they performed compare to other chains and the market economic conditions? (2007-2013)
What do you see in Chipotles future?
Step by Step Solution
There are 3 Steps involved in it
Step: 1

Get Instant Access to Expert-Tailored Solutions
See step-by-step solutions with expert insights and AI powered tools for academic success
Step: 2

Step: 3

Ace Your Homework with AI
Get the answers you need in no time with our AI-driven, step-by-step assistance
Get Started


