Take a look at EMPIRICAL ILLUSTRATION OF INTERNATIONAL FLOWS OF PRODUCTION FACTORS and make overview of attachments, describe in short most visible changes.
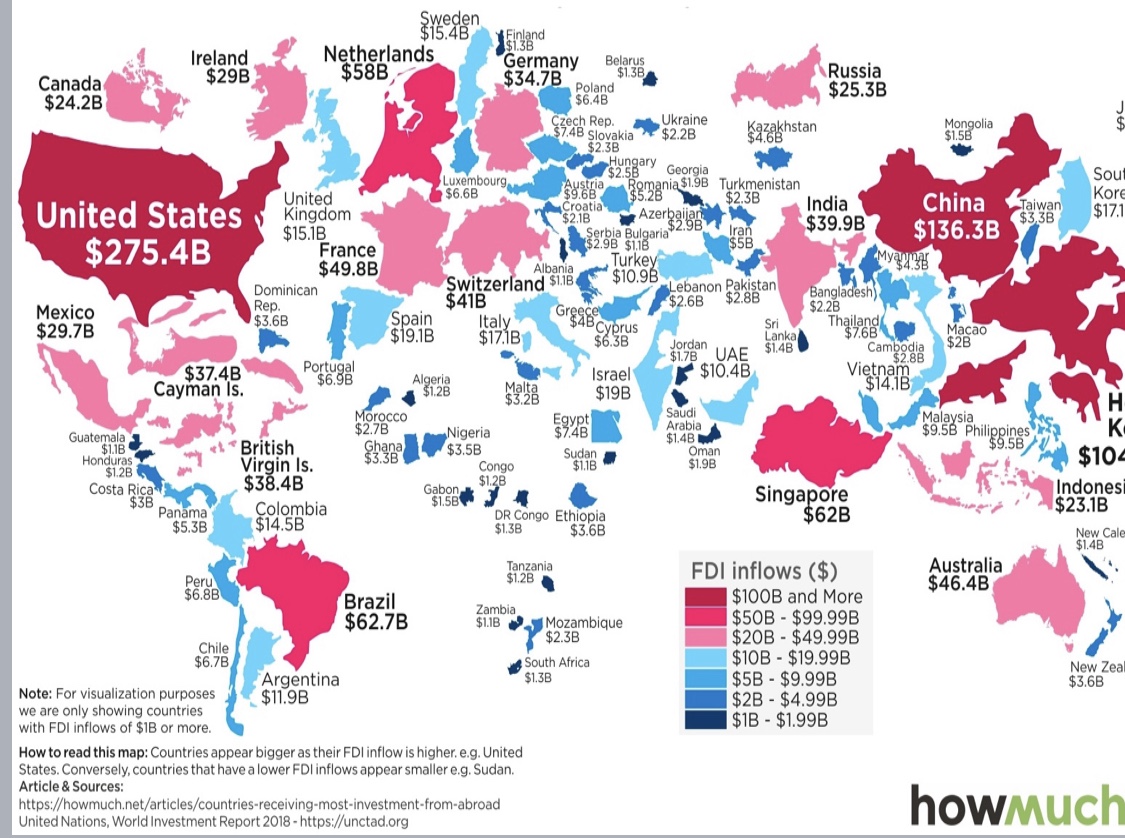
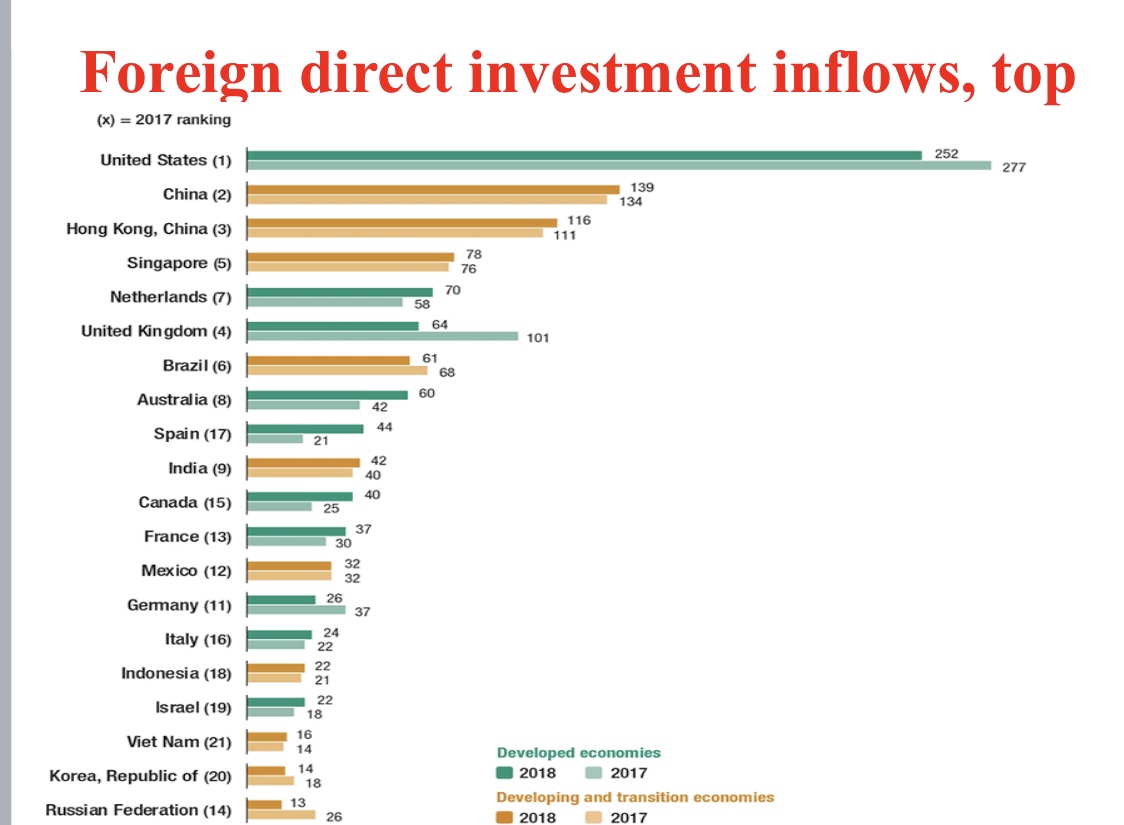
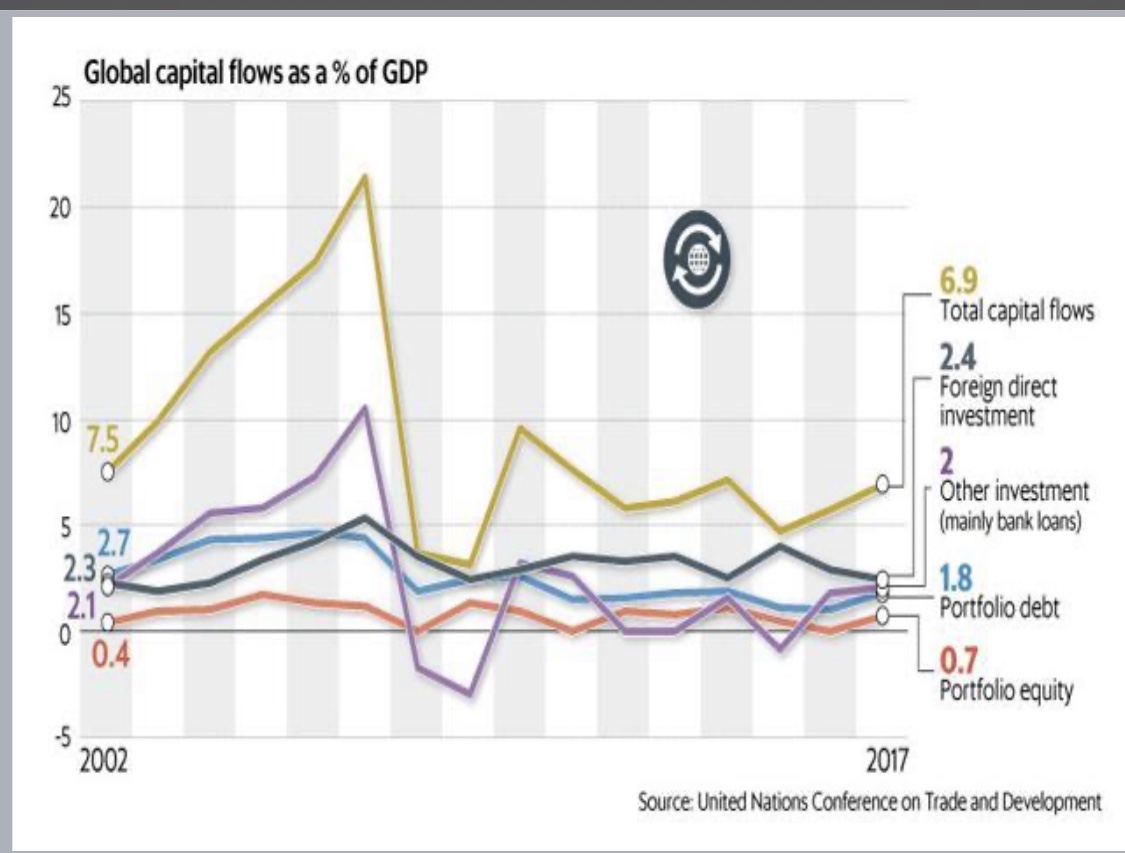
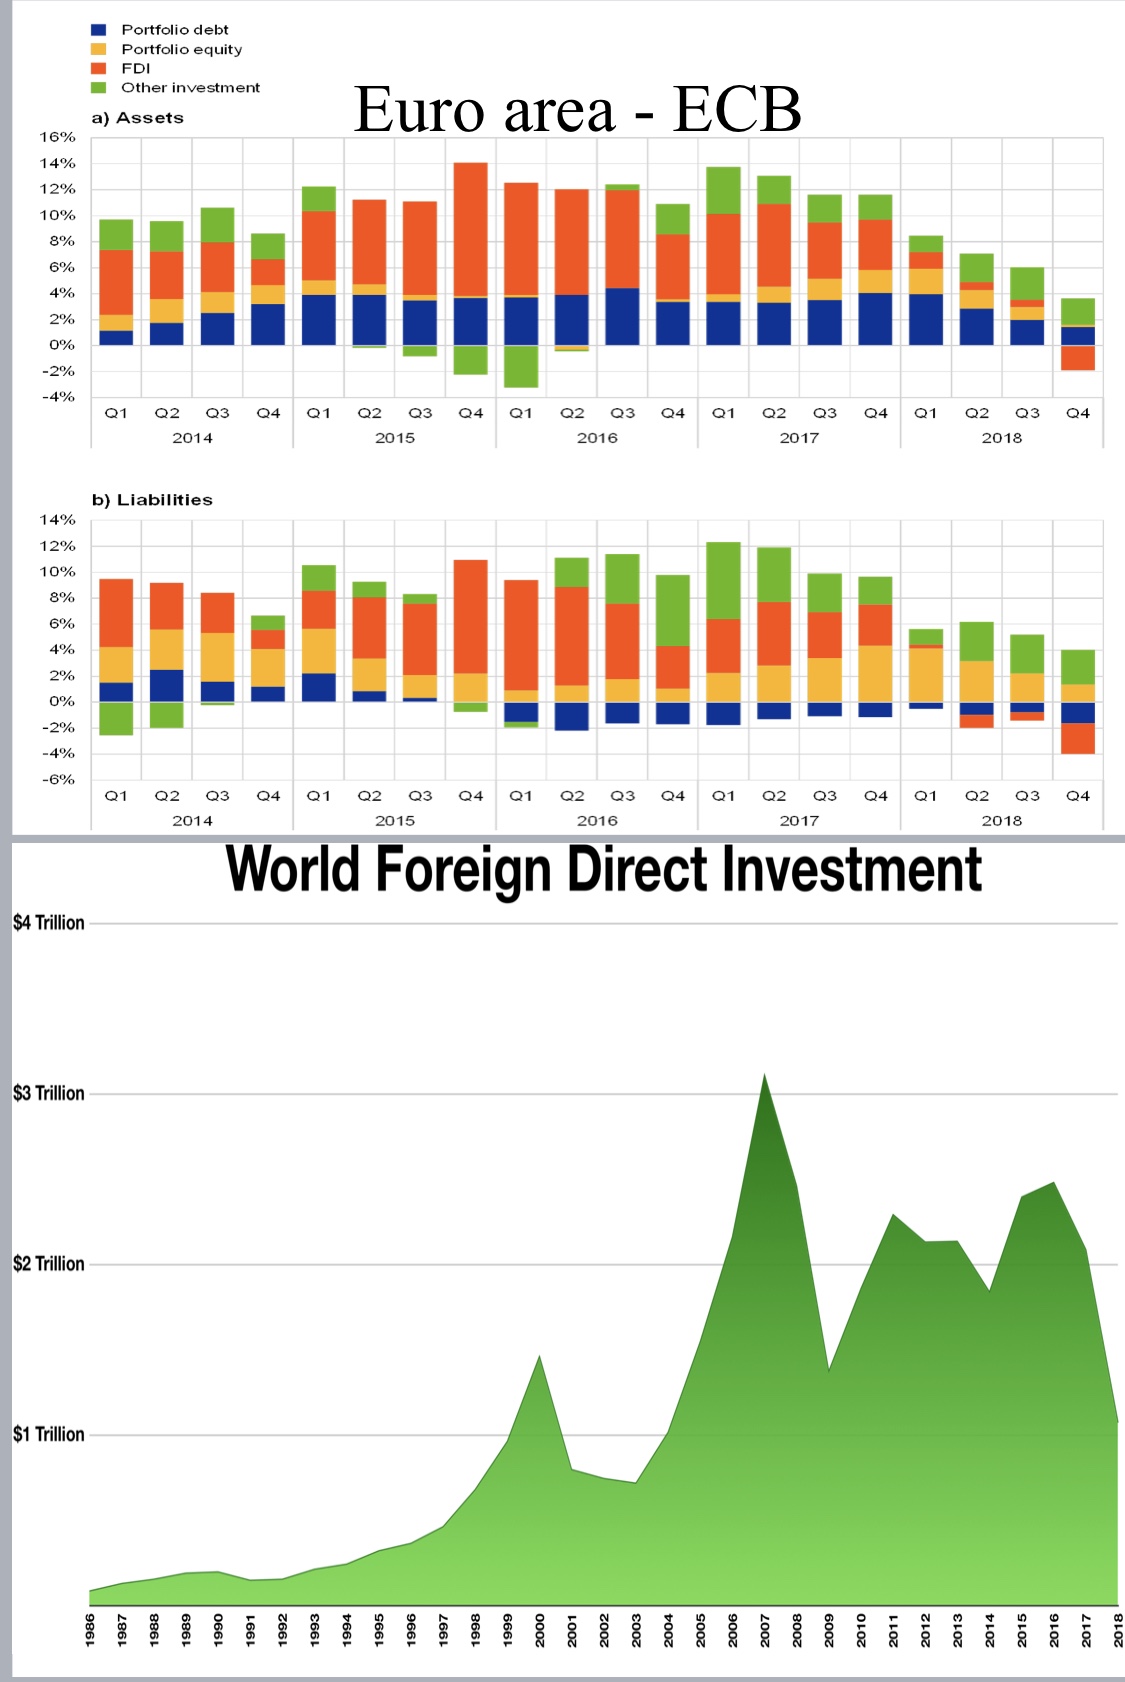
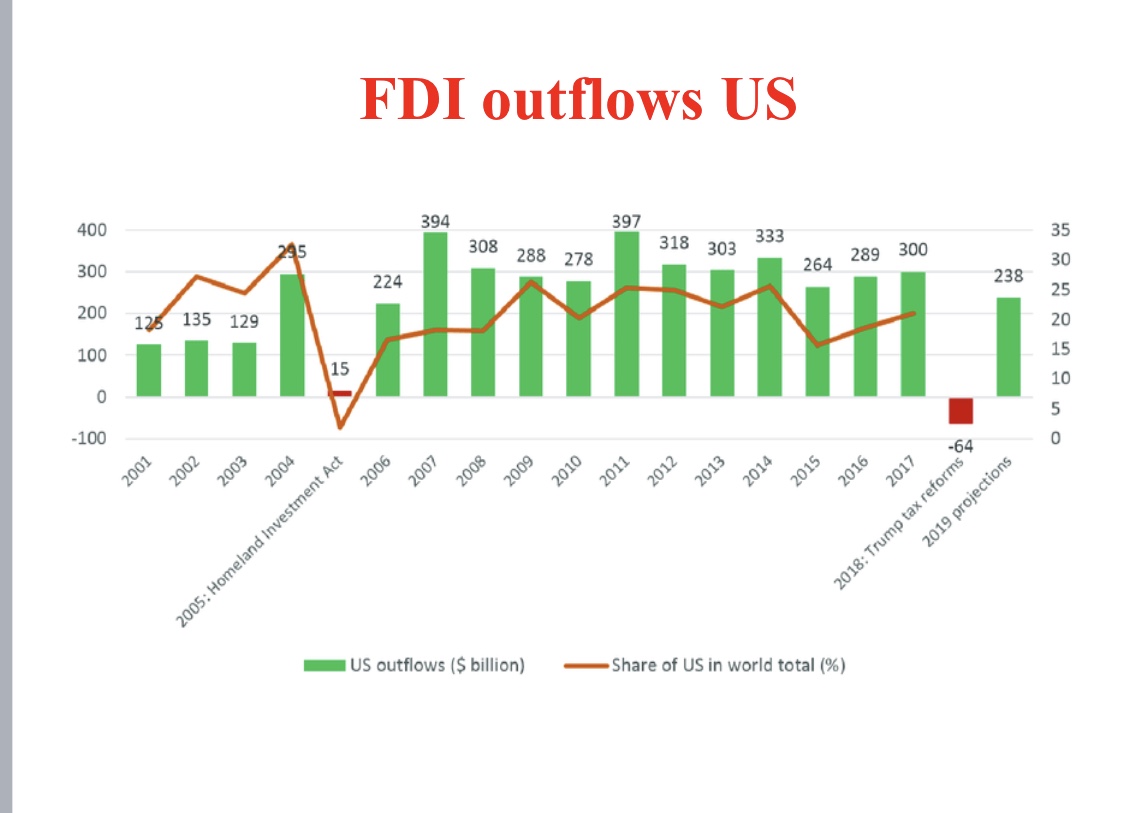
Sweden $15.4B Finland Ireland Netherlands Germany Belarus $58B $34.7B $1.38 Russia Canada $29B Poland $25.3B $24.2B $6.4B czech Rep. Ukraine Kazakhstan Mongolia $7.48 Slovakia $2.2B $1.58 $2.3B Hungary $2.58 Georgia Sou Luxembourg $6.68 69 68 Romania $1.98 Turkmenistan United $5.28 $2.38 United States Croatia India China Kore Taiwan Kingdom $2.18 Azerbalbe $3 3B $17.1 $15.1B Serbia Bulgaria $39.9B iran $136.3B $275.4B France $2.98 $1.18 $5B $49.8B Albania Turkey $10.9B Dominican Switzerland $1.18 Lebanon Pakistan Bangladesh Rep. $41B $2.68 $2.8B Mexico $2.2B $3.6B Spain Greece Italy $4B Cyprus Sri Thailand $29.7B $19.1B $17.1B Lanka $7.6B Macao $6.3B Jordan $2B $1.78 UAE $1.48 Cambodia $37.4B Portugal $10.4B Vietnam $6.9B Algeria Israel Cayman Is. Malta $19B $14.1B $1.28 $3.28 Morocco Nigeria Egypt Saud Malaysia $2.7B Arabia Guatemala $1.48 $9.58 Philippine $1.1B 41 * British $3.5B $9.56 Sudan Oman Honduras Virgin Is. $3.3B $1.1B $1.9B $10 $1.2B Congo $38.4B $1.28 Costa Rica Gabon Indones $3B Colombia $1.58 Singapore $62B $23.1B Panama $5.3B $14.5B DR Congo Ethiopia $1.38 $3.6B New Cal $1.4B Tanzania Australia Peru $1.28 FDI inflows ($) $46.4B $6.8B Brazil $10OB and More Zambia $62.7B $1.18 Mozambique $50B - $99.99B $2.3B $20B - $49.99B Chile $6.7B South Africa $10B - $19.99B New Zea Argentina $1.3B $5B - $9.99B $3.6B Note: For visualization purposes $11.9B $2B - $4.99B we are only showing countries $1B - $1.99B with FDI inflows of $1B or more. How to read this map: Countries appear bigger as their FDI inflow is higher. e.g. United States. Conversely, countries that have a lower FDI inflows appear smaller e.g. Sudan. Article & Sources: https://howmuch.net/articles/countries-receiving-most-investment-from-abroad howmuch United Nations, World Investment Report 2018 - https://unctad.orgForeign direct investment inflows, top (x) = 2017 ranking 252 United States (1) 277 139 China (2) 134 116 Hong Kong, China (3) 111 78 Singapore (5) 76 70 Netherlands (7) 58 64 United Kingdom (4) 101 61 Brazil (6) 68 60 Australia (8) 42 Spain (17) 44 21 India (9) 42 40 40 Canada (15) 25 37 France (13) 30 Mexico (12) 32 32 Germany (11) 26 37 Italy (16) 24 22 22 Indonesia (18) 21 22 Israel (19) 18 Viet Nam (21) 16 14 Developed economies Korea, Republic of (20) 14 2018 2017 18 Developing and transition economies Russian Federation (14) 13 26 2018 2017Global capital flows as a % of GDP 25 20 6.9 15 Total capital flows 2.4 Foreign direct 10 investment 7.5 2 Other investment 5 27 (mainly bank loans) 2.3 1.8 2.1 Portfolio debt 0 0.4 0.7 Portfolio equity -5 2002 2017 Source: United Nations Conference on Trade and DevelopmentPortfolio debt Portfolio equity FDI Other investment a) Assets 16% Euro area - ECB 14% 12% 10% 8% 6% 4% 2% 0% -2% -4% Q1 Q2 Q3 Q4 Q1 Q2 Q3 Q4 Q1 Q2 Q3 Q4 Q1 Q2 Q3 Q4 Q1 Q2 Q3 Q4 2014 2015 2016 2017 2018 b) Liabilities 14% 12% 10% 8% 6% 4% 2% 0% -2% -4% -6% Q1 Q2 Q3 Q4 Q1 Q2 Q3 Q4 Q1 Q2 Q3 Q4 Q1 Q2 Q3 Q4 Q1 Q2 Q3 Q4 2014 2015 2016 2017 2018 World Foreign Direct Investment $4 Trillion $3 Trillion $2 Trillion $1 Trillion 1986 1988 1995 1987 1989 0661 1992 1993 1994 666L 1996 1998 L661 2661 2003 2000 2001 2002 2005 2004 2007 2006 2009 2008 2010 2012 2013 2014 2015 2011 2016 2017FDI outflows US 400 394 397 35 95 308 318 303 333 300 288 278 264 289 300 30 224 238 25 200 125 135 129 20 100 15 15 0 10 -100 -64 001 2002 2003 2004 2006 200 2008 2009 2010 201 2012 2013 2014 2015 2017 ms 201 19 projections mp tax re 2005: Homeland Investment Act 2018: US outflows ($ billion) -Share of US in world total (%)