Take only Take the FY2019(March31,2019)
Calculate B/S P/L percentages/ratios
Rounding, the number of figures below decimal point
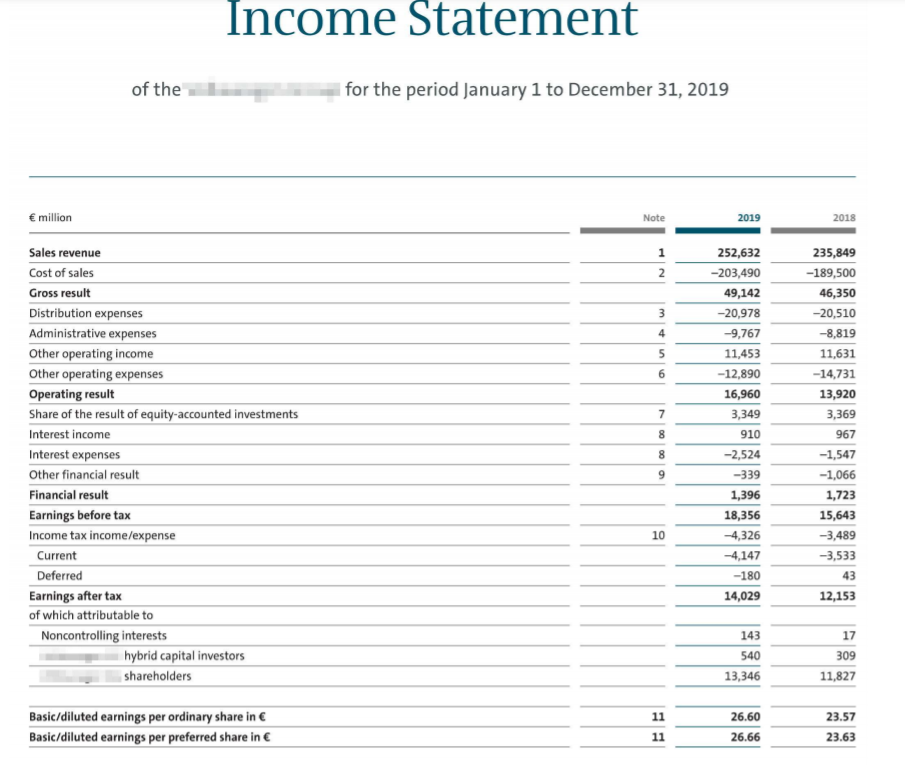

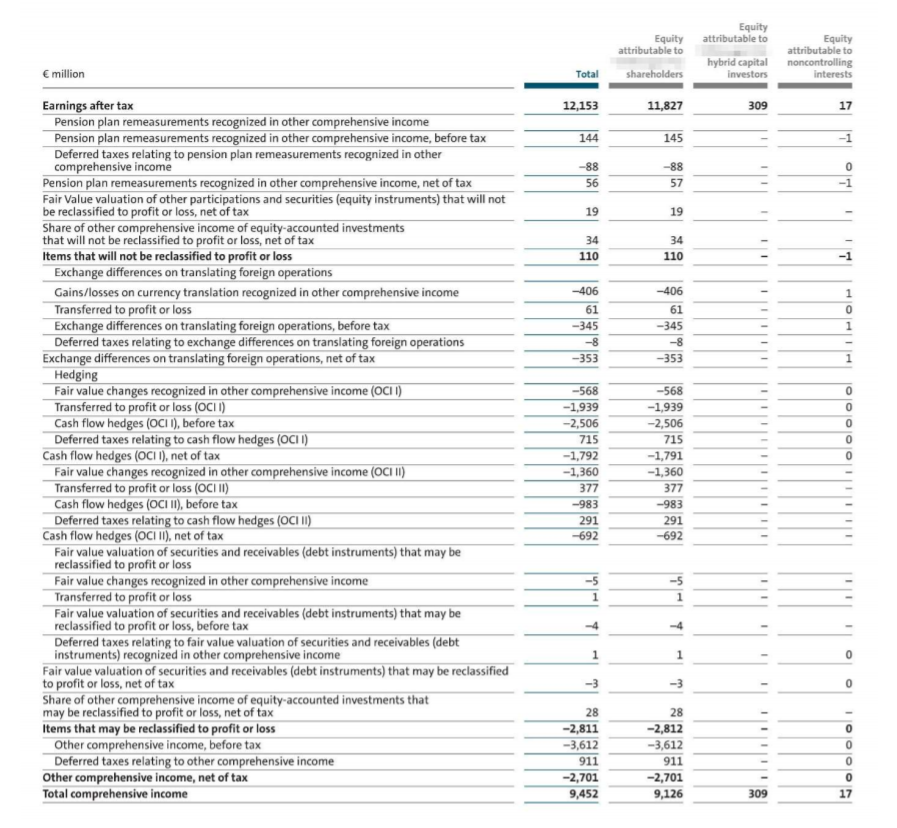
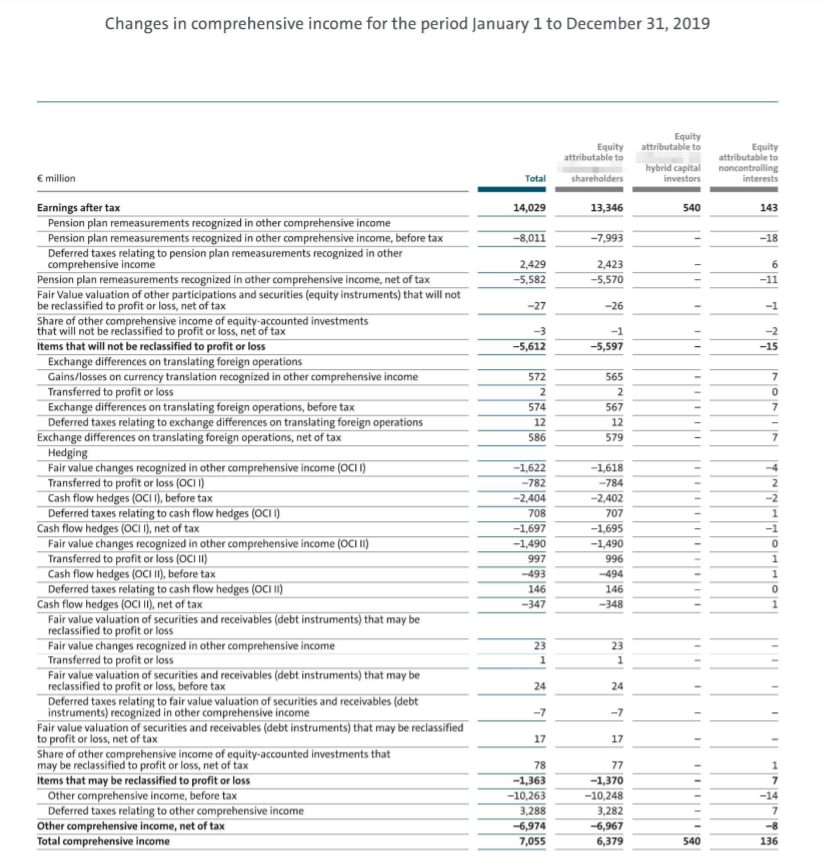
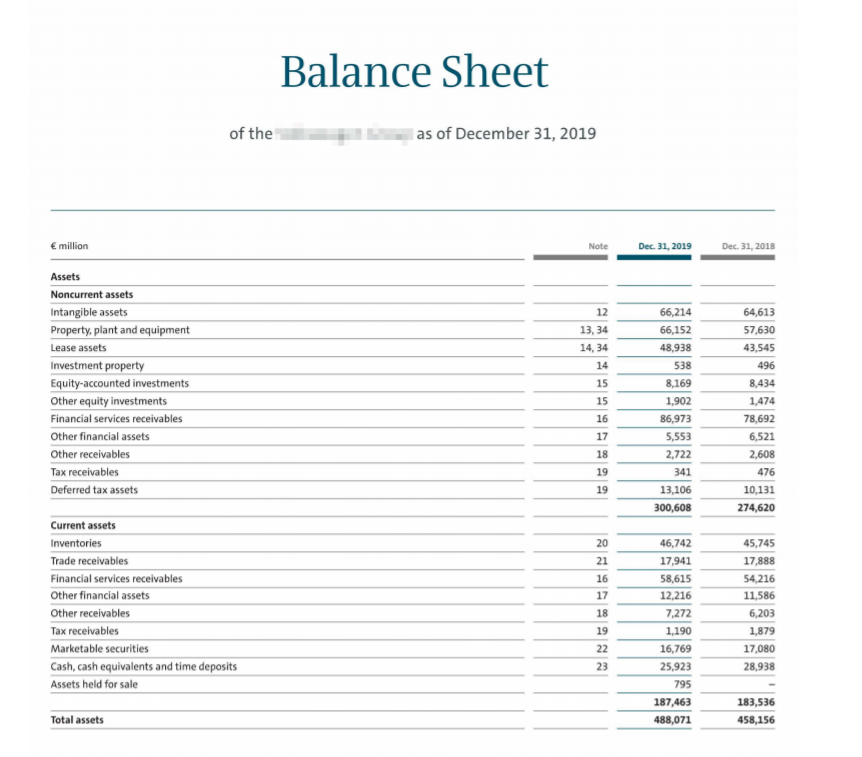
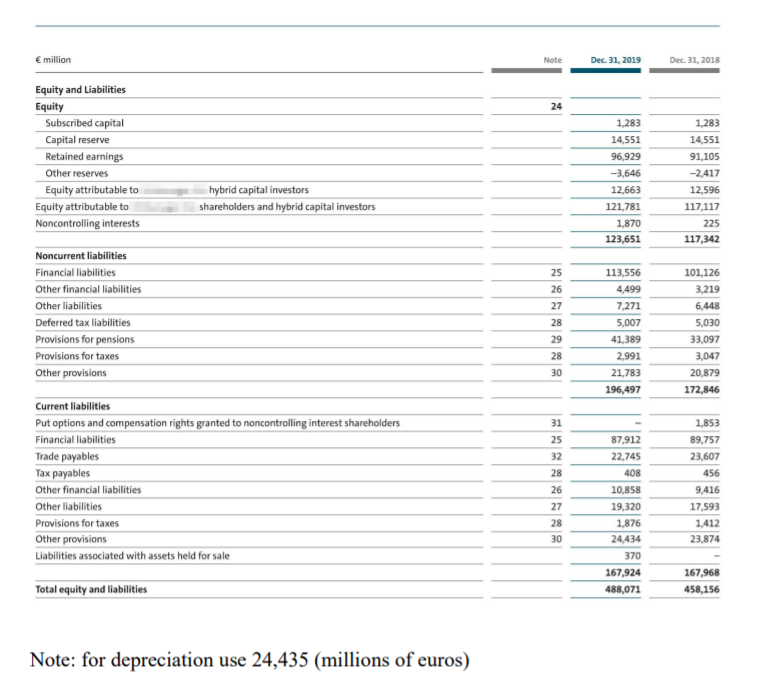
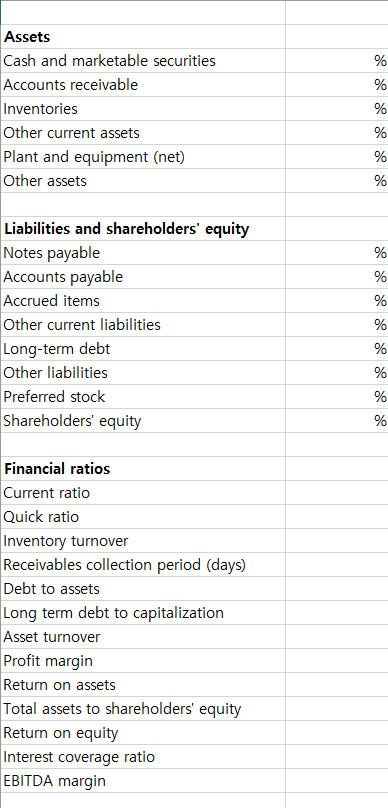
Income Statement of the for the period January 1 to December 31, 2019 million Note 2019 2018 1 2 3 4 4 5 6 7 252,632 -203,490 49,142 -20,978 -9,767 11,453 -12,890 16,960 3,349 910 -2,524 -339 1,396 18,356 -4,326 -4,147 -180 14,029 Sales revenue Cost of sales Gross result Distribution expenses Administrative expenses Other operating income Other operating expenses Operating result Share of the result of equity-accounted investments Interest income Interest expenses Other financial result Financial result Earnings before tax Income tax income/expense Current Deferred Earnings after tax of which attributable to Noncontrolling interests hybrid capital investors shareholders 235,849 -189,500 46,350 -20,510 -8,819 11,631 -14,731 13,920 3,369 967 -1,547 -1,066 1,723 15,643 -3,489 -3,533 43 12,153 8 8 9 10 143 540 17 309 11,827 13,346 11 23.57 Basic/diluted earnings per ordinary share in Basic/diluted earnings per preferred share in 26.60 26.66 11 23.63 Statement of Comprehensive Income Changes in comprehensive income for the period January 1 to December 31, 2018 Equity Equity attributable to shareholders attributable to Equity attributable to hybrid capital noncontrolling investors interests million Total 12,153 11,827 309 17 144 145 -88 56 -88 57 0 -1 19 19 - 34 110 34 110 1 HI 0 -406 61 -345 -8 -353 -406 61 -345 -8 -353 0 0 0 0 Earnings after tax Pension plan remeasurements recognized in other comprehensive income Pension plan remeasurements recognized in other comprehensive income, before tax Deferred taxes relating to pension plan remeasurements recognized in other comprehensive income Pension plan remeasurements recognized in other comprehensive income, net of tax Fair Value valuation of other participations and securities (equity instruments) that will not be reclassified to profit or loss, net of tax Share of other comprehensive income of equity-accounted investments that will not be reclassified to profit or loss, net of tax Items that will not be reclassified to profit or loss Exchange differences on translating foreign operations Gains/losses on currency translation recognized in other comprehensive income Transferred to profit or loss Exchange differences on translating foreign operations, before tax Deferred taxes relating to exchange differences on translating foreign operations Exchange differences on translating foreign operations, net of tax Hedging Fair value changes recognized in other comprehensive income (OCII) Transferred to profit or loss (OCII) Cash flow hedges (OCII), before tax Deferred taxes relating to cash flow hedges (OCII) Cash flow hedges (OCII), net of tax Fair value changes recognized in other comprehensive income (OCIII) Transferred to profit or loss (OCI II) Cash flow hedges (OCIII), before tax Deferred taxes relating to cash flow hedges (OCIII) Cash flow hedges (OCIII), net of tax Fair value valuation of securities and receivables (debt instruments) that may be reclassified to profit or loss Fair value changes recognized in other comprehensive income Transferred to profit or loss Fair value valuation of securities and receivables (debt instruments) that may be reclassified to profit or loss, before tax Deferred taxes relating to fair value valuation of securities and receivables (debt instruments) recognized in other comprehensive income Fair value valuation of securities and receivables (debt instruments) that may be reclassified to profit or loss, net of tax Share of other comprehensive income of equity-accounted investments that may be reclassified to profit or loss, net of tax Items that may be reclassified to profit or loss Other comprehensive income, before tax Deferred taxes relating to other comprehensive income Other comprehensive income, net of tax Total comprehensive income -568 -1,939 -2,506 715 -1,792 -1,360 377 -983 291 -692 -568 -1,939 -2,506 715 -1,791 -1,360 377 -983 291 -692 -5 -5 1 11 -4 -4 - 1 - 1 0 0 - 28 -2,811 -3,612 911 -2,701 9,452 28 -2,812 --3,612 911 -2,701 9,126 OOO 0 17 309 Changes in comprehensive income for the period January 1 to December 31, 2019 Equity attributable to Equity attributable to hybrid capital investors Equity attributable to noncontrolling interests million Total shareholders 14,029 13,346 540 143 -8,011 -7,993 -18 2,429 -5,582 2,423 -5,570 6 -11 -27 -26 - 1 -3 -5,612 -1 -5,597 II -2 -15 7 572 2 574 12 586 565 2 567 12 579 NONIN 7 -2 Earnings after tax Pension plan remeasurements recognized in other comprehensive income Pension plan remeasurements recognized in other comprehensive income, before tax Deferred taxes relating to pension plan remeasurements recognized in other comprehensive income Pension plan remeasurements recognized in other comprehensive income, net of tax Fair Value valuation of other participations and securities (equity instruments) that will not be reclassified to profit or loss, net of tax Share of other comprehensive income of equity-accounted investments that will not be reclassified to profit or loss, net of tax Items that will not be reclassified to profit or loss Exchange differences on translating foreign operations Gains/losses on currency translation recognized in other comprehensive income Transferred to profit or loss Exchange differences on translating foreign operations, before tax Deferred taxes relating to exchange differences on translating foreign operations Exchange differences on translating foreign operations, net of tax Hedging Fair value changes recognized in other comprehensive income (OCII) Transferred to profit or loss (OCII) Cash flow hedges (OCII), before tax Deferred taxes relating to cash flow hedges (OCII) Cash flow hedges (OCII), net of tax Fair value changes recognized in other comprehensive income (OCIII) Transferred to profit or loss (OCI II) Cash flow hedges (OCI II), before tax Deferred taxes relating to cash flow hedges (OCI II) Cash flow hedges (OCI II), net of tax Fair value valuation of securities and receivables (debt instruments) that may be reclassified to profit or loss Fair value changes recognized in other comprehensive income Transferred to profit or loss Fair value valuation of securities and receivables (debt instruments) that may be reclassified to profit or loss, before tax Deferred taxes relating to fair value valuation of securities and receivables (debt instruments) recognized in other comprehensive income Fair value valuation of securities and receivables (debt instruments) that may be reclassified to profit or loss, net of tax Share of other comprehensive income of equity-accounted investments that may be reclassified to profit or loss, net of tax Items that may be reclassified to profit or loss Other comprehensive income, before tax Deferred taxes relating to other comprehensive income Other comprehensive income, net of tax Total comprehensive income -1,622 -782 -2,404 708 -1,697 -1,490 997 -493 146 -347 -1,618 -784 -2,402 707 -1,695 -1,490 996 -494 146 -348 0 1 1 0 23 1 23 1 24 24 - - | -7 -7 - - 17 17 - - 78 -1,363 -10,263 3,288 -6,974 7,055 77 -1,370 -10,248 3,282 -6,967 6,379 1 7 -14 7 -8 136 540 Balance Sheet of the as of December 31, 2019 million Note Dec 31, 2019 Dec 31, 2018 12 13, 34 14, 34 14 66,214 66,152 48,938 538 Assets Noncurrent assets Intangible assets Property, plant and equipment Lease assets Investment property Equity-accounted investments Other equity investments Financial services receivables Other financial assets Other receivables Tax receivables Deferred tax assets 15 15 16 17 8.169 1,902 86,973 5,553 2,722 341 13,106 300,608 64,613 57,630 43,545 496 8,434 1,474 78,692 6,521 2,608 476 10,131 274,620 18 19 19 46,742 Current assets Inventories Trade receivables Financial services receivables Other financial assets Other receivables Tax receivables Marketable securities Cash, cash equivalents and time deposits Assets held for sale 21 16 17 18 19 & # 3 4 5 6 17,941 58,615 12,216 7,272 1,190 16,769 25,923 795 187,463 488,071 45,745 17,888 54,216 11,586 6,203 1,879 17,080 28,938 22 23 183,536 458,156 Total assets million Note Dec 31, 2019 Dec 31, 2018 24 1,283 Equity and Liabilities Equity Subscribed capital Capital reserve Retained earnings Other reserves Equity attributable to Equity attributable to Noncontrolling interests 1,283 14,551 91.105 -2,417 12,596 117,117 225 117,342 14,551 96,929 -3,646 12,663 121,781 1,870 123,651 hybrid capital investors shareholders and hybrid capital investors Noncurrent liabilities Financial liabilities Other financial liabilities Other liabilities Deferred tax liabilities Provisions for pensions Provisions for taxes Other provisions 25 26 27 28 29 113,556 4,499 7,271 5,007 41,389 2,991 21,783 196,497 101,126 3,219 6,448 5,030 33,097 3,047 20,879 172,846 28 30 31 25 Current liabilities Put options and compensation rights granted to noncontrolling interest shareholders Financial liabilities Trade payables Tax payables Other financial liabilities Other liabilities Provisions for taxes Other provisions Liabilities associated with assets held for sale 32 28 26 27 28 30 87,912 22,745 408 10,858 19,320 1,876 24,434 370 167,924 488,071 1,853 89,757 23,607 456 9,416 17,593 1,412 23,874 167,968 458,156 Total equity and liabilities Note: for depreciation use 24,435 (millions of euros) Assets Cash and marketable securities Accounts receivable Inventories Other current assets Plant and equipment (net) Other assets % % % % % % Liabilities and shareholders' equity Notes payable Accounts payable Accrued items Other current liabilities Long-term debt Other liabilities Preferred stock Shareholders' equity % % % % % % % % Financial ratios Current ratio Quick ratio Inventory turnover Receivables collection period (days) Debt to assets Long term debt to capitalization Asset turnover Profit margin Return on assets Total assets to shareholders' equity Return on equity Interest coverage ratio EBITDA margin Income Statement of the for the period January 1 to December 31, 2019 million Note 2019 2018 1 2 3 4 4 5 6 7 252,632 -203,490 49,142 -20,978 -9,767 11,453 -12,890 16,960 3,349 910 -2,524 -339 1,396 18,356 -4,326 -4,147 -180 14,029 Sales revenue Cost of sales Gross result Distribution expenses Administrative expenses Other operating income Other operating expenses Operating result Share of the result of equity-accounted investments Interest income Interest expenses Other financial result Financial result Earnings before tax Income tax income/expense Current Deferred Earnings after tax of which attributable to Noncontrolling interests hybrid capital investors shareholders 235,849 -189,500 46,350 -20,510 -8,819 11,631 -14,731 13,920 3,369 967 -1,547 -1,066 1,723 15,643 -3,489 -3,533 43 12,153 8 8 9 10 143 540 17 309 11,827 13,346 11 23.57 Basic/diluted earnings per ordinary share in Basic/diluted earnings per preferred share in 26.60 26.66 11 23.63 Statement of Comprehensive Income Changes in comprehensive income for the period January 1 to December 31, 2018 Equity Equity attributable to shareholders attributable to Equity attributable to hybrid capital noncontrolling investors interests million Total 12,153 11,827 309 17 144 145 -88 56 -88 57 0 -1 19 19 - 34 110 34 110 1 HI 0 -406 61 -345 -8 -353 -406 61 -345 -8 -353 0 0 0 0 Earnings after tax Pension plan remeasurements recognized in other comprehensive income Pension plan remeasurements recognized in other comprehensive income, before tax Deferred taxes relating to pension plan remeasurements recognized in other comprehensive income Pension plan remeasurements recognized in other comprehensive income, net of tax Fair Value valuation of other participations and securities (equity instruments) that will not be reclassified to profit or loss, net of tax Share of other comprehensive income of equity-accounted investments that will not be reclassified to profit or loss, net of tax Items that will not be reclassified to profit or loss Exchange differences on translating foreign operations Gains/losses on currency translation recognized in other comprehensive income Transferred to profit or loss Exchange differences on translating foreign operations, before tax Deferred taxes relating to exchange differences on translating foreign operations Exchange differences on translating foreign operations, net of tax Hedging Fair value changes recognized in other comprehensive income (OCII) Transferred to profit or loss (OCII) Cash flow hedges (OCII), before tax Deferred taxes relating to cash flow hedges (OCII) Cash flow hedges (OCII), net of tax Fair value changes recognized in other comprehensive income (OCIII) Transferred to profit or loss (OCI II) Cash flow hedges (OCIII), before tax Deferred taxes relating to cash flow hedges (OCIII) Cash flow hedges (OCIII), net of tax Fair value valuation of securities and receivables (debt instruments) that may be reclassified to profit or loss Fair value changes recognized in other comprehensive income Transferred to profit or loss Fair value valuation of securities and receivables (debt instruments) that may be reclassified to profit or loss, before tax Deferred taxes relating to fair value valuation of securities and receivables (debt instruments) recognized in other comprehensive income Fair value valuation of securities and receivables (debt instruments) that may be reclassified to profit or loss, net of tax Share of other comprehensive income of equity-accounted investments that may be reclassified to profit or loss, net of tax Items that may be reclassified to profit or loss Other comprehensive income, before tax Deferred taxes relating to other comprehensive income Other comprehensive income, net of tax Total comprehensive income -568 -1,939 -2,506 715 -1,792 -1,360 377 -983 291 -692 -568 -1,939 -2,506 715 -1,791 -1,360 377 -983 291 -692 -5 -5 1 11 -4 -4 - 1 - 1 0 0 - 28 -2,811 -3,612 911 -2,701 9,452 28 -2,812 --3,612 911 -2,701 9,126 OOO 0 17 309 Changes in comprehensive income for the period January 1 to December 31, 2019 Equity attributable to Equity attributable to hybrid capital investors Equity attributable to noncontrolling interests million Total shareholders 14,029 13,346 540 143 -8,011 -7,993 -18 2,429 -5,582 2,423 -5,570 6 -11 -27 -26 - 1 -3 -5,612 -1 -5,597 II -2 -15 7 572 2 574 12 586 565 2 567 12 579 NONIN 7 -2 Earnings after tax Pension plan remeasurements recognized in other comprehensive income Pension plan remeasurements recognized in other comprehensive income, before tax Deferred taxes relating to pension plan remeasurements recognized in other comprehensive income Pension plan remeasurements recognized in other comprehensive income, net of tax Fair Value valuation of other participations and securities (equity instruments) that will not be reclassified to profit or loss, net of tax Share of other comprehensive income of equity-accounted investments that will not be reclassified to profit or loss, net of tax Items that will not be reclassified to profit or loss Exchange differences on translating foreign operations Gains/losses on currency translation recognized in other comprehensive income Transferred to profit or loss Exchange differences on translating foreign operations, before tax Deferred taxes relating to exchange differences on translating foreign operations Exchange differences on translating foreign operations, net of tax Hedging Fair value changes recognized in other comprehensive income (OCII) Transferred to profit or loss (OCII) Cash flow hedges (OCII), before tax Deferred taxes relating to cash flow hedges (OCII) Cash flow hedges (OCII), net of tax Fair value changes recognized in other comprehensive income (OCIII) Transferred to profit or loss (OCI II) Cash flow hedges (OCI II), before tax Deferred taxes relating to cash flow hedges (OCI II) Cash flow hedges (OCI II), net of tax Fair value valuation of securities and receivables (debt instruments) that may be reclassified to profit or loss Fair value changes recognized in other comprehensive income Transferred to profit or loss Fair value valuation of securities and receivables (debt instruments) that may be reclassified to profit or loss, before tax Deferred taxes relating to fair value valuation of securities and receivables (debt instruments) recognized in other comprehensive income Fair value valuation of securities and receivables (debt instruments) that may be reclassified to profit or loss, net of tax Share of other comprehensive income of equity-accounted investments that may be reclassified to profit or loss, net of tax Items that may be reclassified to profit or loss Other comprehensive income, before tax Deferred taxes relating to other comprehensive income Other comprehensive income, net of tax Total comprehensive income -1,622 -782 -2,404 708 -1,697 -1,490 997 -493 146 -347 -1,618 -784 -2,402 707 -1,695 -1,490 996 -494 146 -348 0 1 1 0 23 1 23 1 24 24 - - | -7 -7 - - 17 17 - - 78 -1,363 -10,263 3,288 -6,974 7,055 77 -1,370 -10,248 3,282 -6,967 6,379 1 7 -14 7 -8 136 540 Balance Sheet of the as of December 31, 2019 million Note Dec 31, 2019 Dec 31, 2018 12 13, 34 14, 34 14 66,214 66,152 48,938 538 Assets Noncurrent assets Intangible assets Property, plant and equipment Lease assets Investment property Equity-accounted investments Other equity investments Financial services receivables Other financial assets Other receivables Tax receivables Deferred tax assets 15 15 16 17 8.169 1,902 86,973 5,553 2,722 341 13,106 300,608 64,613 57,630 43,545 496 8,434 1,474 78,692 6,521 2,608 476 10,131 274,620 18 19 19 46,742 Current assets Inventories Trade receivables Financial services receivables Other financial assets Other receivables Tax receivables Marketable securities Cash, cash equivalents and time deposits Assets held for sale 21 16 17 18 19 & # 3 4 5 6 17,941 58,615 12,216 7,272 1,190 16,769 25,923 795 187,463 488,071 45,745 17,888 54,216 11,586 6,203 1,879 17,080 28,938 22 23 183,536 458,156 Total assets million Note Dec 31, 2019 Dec 31, 2018 24 1,283 Equity and Liabilities Equity Subscribed capital Capital reserve Retained earnings Other reserves Equity attributable to Equity attributable to Noncontrolling interests 1,283 14,551 91.105 -2,417 12,596 117,117 225 117,342 14,551 96,929 -3,646 12,663 121,781 1,870 123,651 hybrid capital investors shareholders and hybrid capital investors Noncurrent liabilities Financial liabilities Other financial liabilities Other liabilities Deferred tax liabilities Provisions for pensions Provisions for taxes Other provisions 25 26 27 28 29 113,556 4,499 7,271 5,007 41,389 2,991 21,783 196,497 101,126 3,219 6,448 5,030 33,097 3,047 20,879 172,846 28 30 31 25 Current liabilities Put options and compensation rights granted to noncontrolling interest shareholders Financial liabilities Trade payables Tax payables Other financial liabilities Other liabilities Provisions for taxes Other provisions Liabilities associated with assets held for sale 32 28 26 27 28 30 87,912 22,745 408 10,858 19,320 1,876 24,434 370 167,924 488,071 1,853 89,757 23,607 456 9,416 17,593 1,412 23,874 167,968 458,156 Total equity and liabilities Note: for depreciation use 24,435 (millions of euros) Assets Cash and marketable securities Accounts receivable Inventories Other current assets Plant and equipment (net) Other assets % % % % % % Liabilities and shareholders' equity Notes payable Accounts payable Accrued items Other current liabilities Long-term debt Other liabilities Preferred stock Shareholders' equity % % % % % % % % Financial ratios Current ratio Quick ratio Inventory turnover Receivables collection period (days) Debt to assets Long term debt to capitalization Asset turnover Profit margin Return on assets Total assets to shareholders' equity Return on equity Interest coverage ratio EBITDA margin


