Question
Take the scenario presented in the Bank Loan case study. For this scenario, come up with 1) the Business opportunity, 2) Business Objectives, 3) Business
Take the scenario presented in the Bank Loan case study. For this scenario, come up with1) the Business opportunity, 2) Business Objectives, 3) Business Questions, 4) Data Analytic questions, 5) Data collection plan of action and 6) the actual hypothesis tests or regression analyses you would do to answer the questions in step 4. (You don't have to do the hypothesis tests or regression analysis here. Just mention what you would do.)
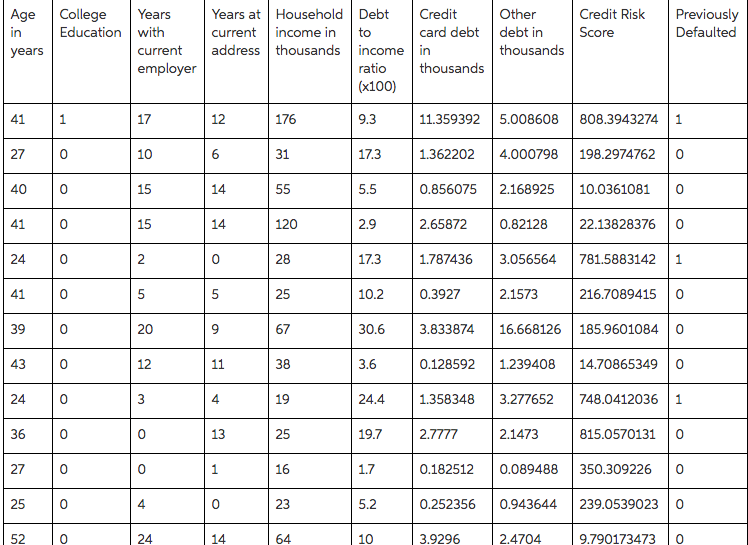
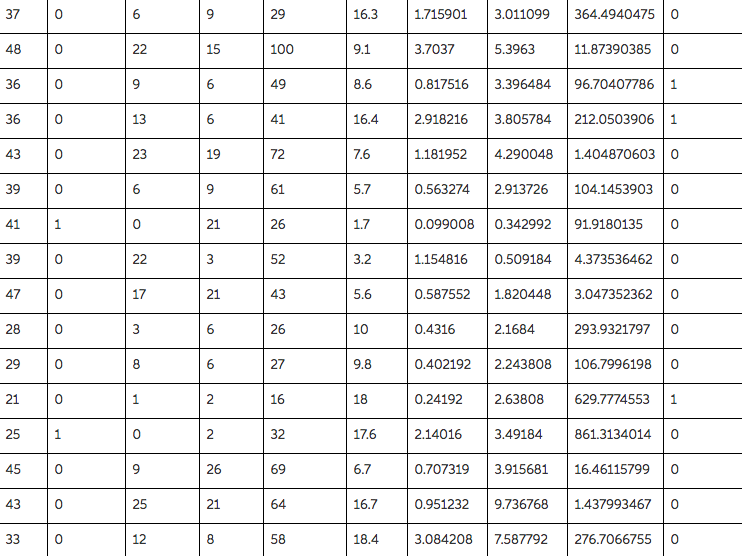
This case study concerns a bank's efforts to reduce the rate of loan defaults. A loan officer at a bank needs to be able to identify characteristics that are indicative of people who are likely to default on loans and use those characteristics to identify good and bad credit risks. The loan officer also needs to be able to better quantify an individual's credit risk level. Information on 850 past and prospective customers in contained in bank loan. The first 700 cases are customers who were previously given loans. The last 150 cases are prospective customers that the bank needs to assess. The data set includes the following variables: 1. Age: customer age in years. 2. College: an indicator of whether the customer has a college education 3. Employment: years that the customer has been with his/her current employer 4. Address: years that the customer has lived at his/her current address 5. Income: household annual income (in $1,000) 6. Debt _to _Income: debt to income ratio (x100) 7. Credit _Debt: credit card debt (in $1,000) 8. Other _Debt: other debt (in $1,000) 9. Risk _Score: Credit risk score (the higher the score, the more risky) 10. Default _Indicator: an indicator of whether the customer had previously defaulted


Step by Step Solution
There are 3 Steps involved in it
Step: 1

Get Instant Access to Expert-Tailored Solutions
See step-by-step solutions with expert insights and AI powered tools for academic success
Step: 2

Step: 3

Ace Your Homework with AI
Get the answers you need in no time with our AI-driven, step-by-step assistance
Get Started


