Answered step by step
Verified Expert Solution
Question
1 Approved Answer
Tamarisk Merchants reported the following on its income statement for the fiscal year ended December 31, 2021 and 2020. 2021 $495,060 2020 $475,390 Sales Cost
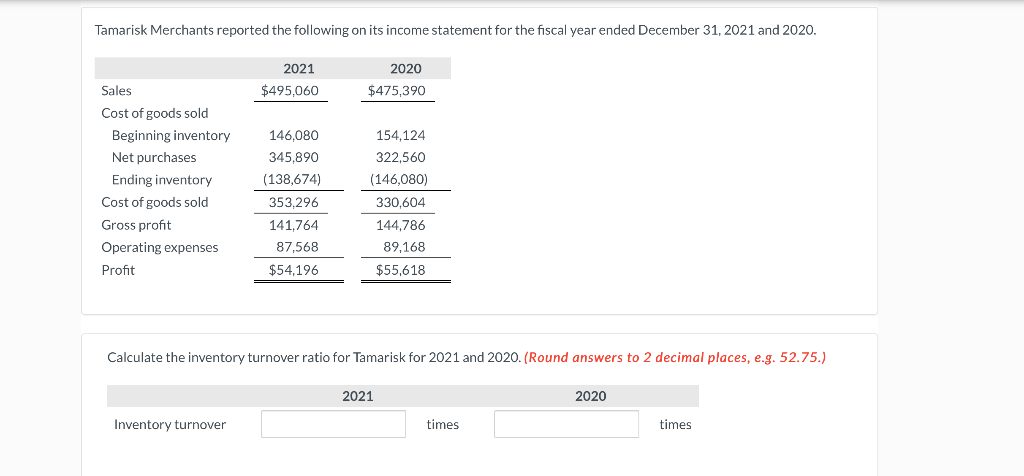
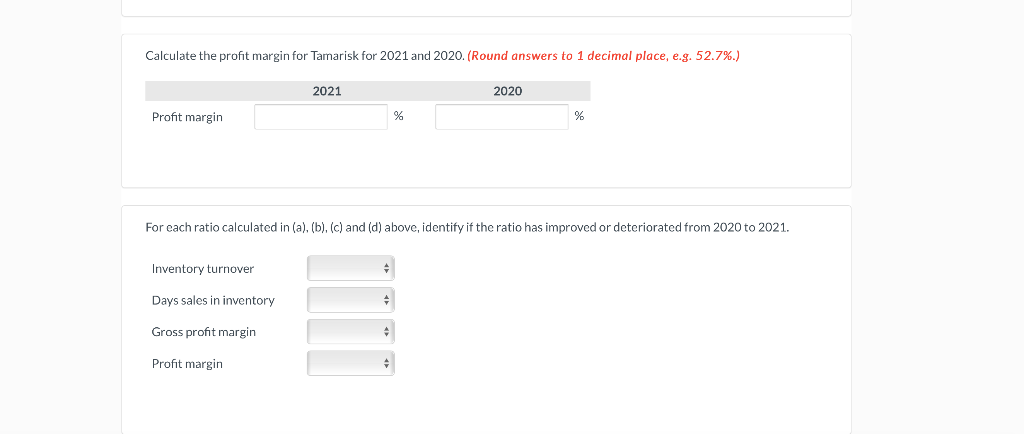
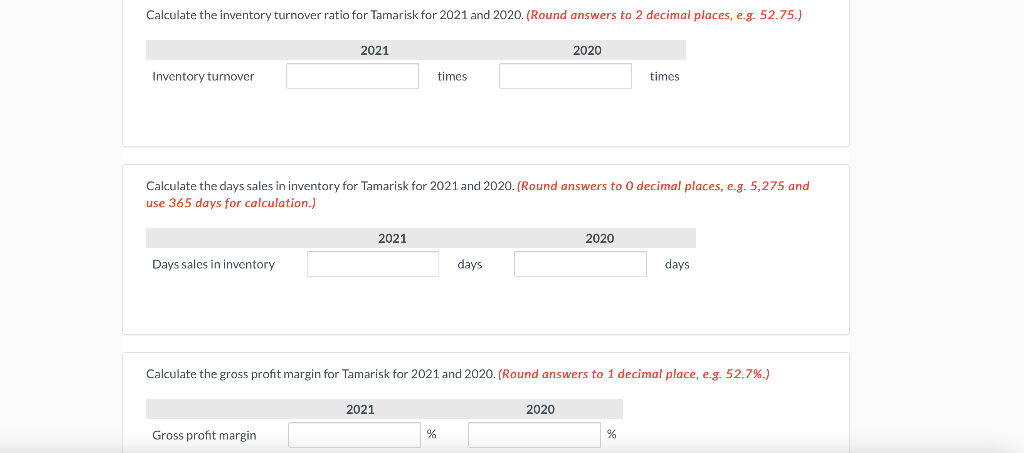
Tamarisk Merchants reported the following on its income statement for the fiscal year ended December 31, 2021 and 2020. 2021 $495,060 2020 $475,390 Sales Cost of goods sold Beginning inventory Net purchases Ending inventory Cost of goods sold Gross profit Operating expenses Profit 146,080 345,890 (138,674) 353,296 141,764 87,568 154,124 322,560 (146,080) 330,604 144,786 89,168 $55,618 $54.196 Calculate the inventory turnover ratio for Tamarisk for 2021 and 2020. (Round answers to 2 decimal places, e.g. 52.75.) 2021 2020 Inventory turnover times times Calculate the inventory turnover ratio for Tamarisk for 2021 and 2020. (Round answers to 2 decimal places, e.g. 52.75.) 2021 2020 Inventory turnover times times Calculate the days sales in inventory for Tamarisk for 2021 and 2020. (Round answers to O decimal places, e.g. 5,275 and use 365 days for calculation.) 2021 2020 Days sales in inventory days days Calculate the gross profit margin for Tamarisk for 2021 and 2020. (Round answers to 1 decimal place, e.g. 52.7%.) 2021 2020 Gross profit margin % Calculate the profit margin for Tamarisk for 2021 and 2020. (Round answers to 1 decimal place, e.g. 52.7%.) 2021 2020 Profit margin % % For each ratio calculated in (a), (b), (c) and (d) above, identify if the ratio has improved or deteriorated from 2020 to 2021. Inventory turnover Days sales in inventory Gross profit margin Profit margin +
Step by Step Solution
There are 3 Steps involved in it
Step: 1
Get Instant Access to Expert-Tailored Solutions
See step-by-step solutions with expert insights and AI powered tools for academic success
Step: 2
Step: 3
Ace Your Homework with AI
Get the answers you need in no time with our AI-driven, step-by-step assistance
Get Started