Task 1: Health Industry A vs B. Which firm has higher/lower/same market growth potential?
Why? Which firm has the higher financial strength to support growth and why?
Task 2: Bear Industry C vs D. According to Porters Business Strategy Volume (or low cost) / Niche / Differentiation. What strategy do you think C and D are pursuing?
Task 3: Identify the top 2 Cashcow firms as measured by FCF i.e., able to generate the highest FCF and why?
Task 4: Identify the top Dog (as in BCG model) among the firms (A to P):
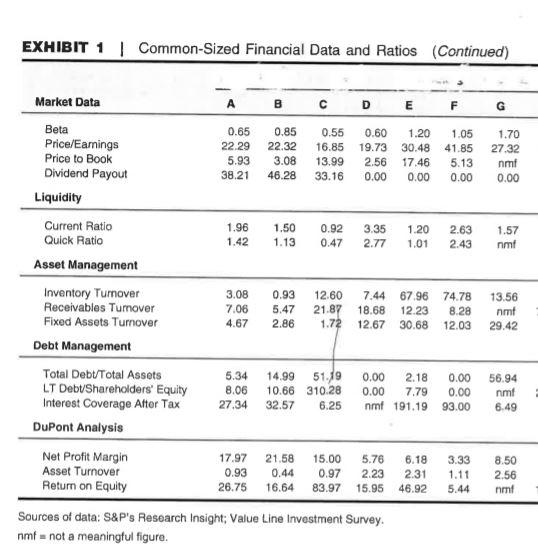
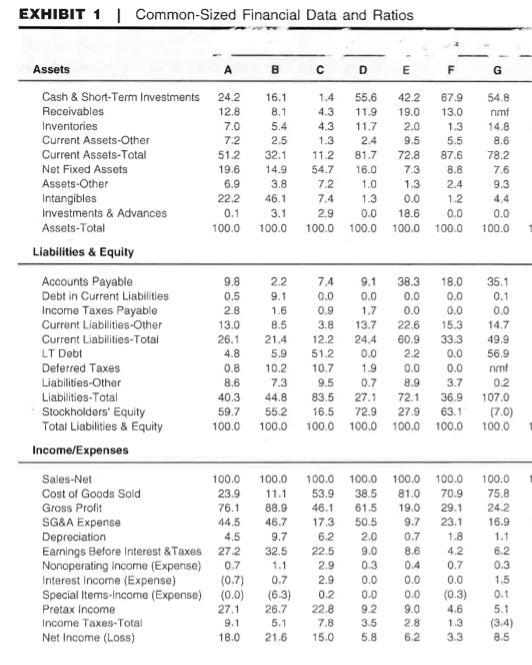
EXHIBIT 1 | Common-Sized Financial Data and Ratios (Continued) F G 1.70 27.32 1.05 41.85 5.13 0.00 nmt 0.00 2.63 2.43 1.57 nmt Market Data A B D E Beta 0.65 0.85 0.55 0.60 1.20 Price/Earnings 22.29 22.32 16.85 19.73 30.48 Price to Book 5.93 3.08 13.99 2.56 17.46 Dividend Payout 38.21 46.28 33.16 0.00 0.00 Liquidity Current Ratio 1.96 1.50 0.92 3.35 1.20 Quick Ratio 1.42 1.13 0.47 2.77 1.01 Asset Management Inventory Tumover 3.08 0.93 12.60 7.44 67.96 Receivables Tumover 7.06 5.47 21.87 18.68 12.23 Fixed Assets Turnover 4.67 2.86 1.72 12.67 30.68 Debt Management Total Debt/Total Assets 5.34 14.99 51.119 0.00 2.18 LT DebtShareholders' Equity 8.06 10.66 310.28 0.00 7.79 Interest Coverage After Tax 27.34 32.57 nmf 191.19 DuPont Analysis Net Profit Margin 17.97 21.58 15.00 5.76 6.18 Asset Turnover 0.93 0.44 0.97 2.23 2.31 Return on Equity 26.75 16.64 83.97 15.95 46.92 Sources of data: S&P's Research Insight; Value Line Investment Survey nmf = not a meaningful figure. 74.78 8.28 12.03 13.56 nmt 29.42 0.00 0.00 93.00 56.94 nmt 6.49 6.25 3.33 1.11 5.44 8.50 2.56 nmt EXHIBIT 1 | Common-Sized Financial Data and Ratios B C D E E F G Assets Cash & Short-Term Investments Receivables Inventories Current Assets-Other Current Assets-Total Net Fixed Assets Assets-Other Intangibles Investments & Advances Assets-Total Liabilities & Equity 24.2 12.8 7.0 7.2 51.2 19.6 6.9 22.2 0.1 100.0 16.1 8.1 5.4 2.5 32.1 14.9 3.8 46.1 3.1 100.0 1.4 4.3 4.3 1.3 11.2 54.7 55.6 11.9 11.7 24 81.7 16.0 1.0 1.3 0.0 100.0 42.2 19.0 2.0 9.5 72.8 7.3 1.3 0.0 18.6 100.0 67.9 13.0 1.3 5.5 87.6 8.8 2.4 1.2 0.0 100.0 54.8 nmt 14.8 8.6 78.2 7.6 9.3 7.2 7.4 2.9 100.0 0.0 100.0 1.7 2.2 9.1 1.6 8.5 21.4 5.9 10.2 7.3 44.8 55.2 100.0 7.4 9.1 38.3 0.0 0.0 0.0 0.9 0.0 3.8 13.7 22.6 12.2 24.4 60.9 51.2 0.0 2.2 10.7 1.9 0.0 9.5 0.7 8.9 83.5 27.1 72.1 16.5 72.9 27.9 100.0 100.0 100.0 18.0 0.0 0.0 15.3 33.3 0.0 0.0 3.7 36.9 63.1 100.0 35.1 0.1 0.0 14.7 49.9 56.9 nmt 0.2 107.0 (7.0) 100.0 Accounts Payable 9.8 Debt in Current Liabilities 0.5 Income Taxes Payable 2.8 Current Liabilities-Other 13.0 Current Liabilities-Total 26.1 LT Debt 4.8 Deferred Taxes 0.8 Liabilities Other 8.6 Liabilities-Total 40.3 Stockholders' Equity 59.7 Total Liabilities & Equity 100.0 Income/Expenses Sales-Net 100.0 Cost of Goods Sold 23.9 Gross Profit 76.1 SG&A Expense 44.5 Depreciation Earnings Before Interest & Taxes 272 Nonoperating income (Expense) 0.7 Interest Income (Expense) Special Items-Income (Expense) (0.0) Pretax Income 27.1 Income Taxes-Total 9.1 Net Income (Loss) 18.0 100.0 75.8 24.2 16.9 4.5 100.0 11.1 88.9 46.7 9.7 32.5 1.1 0.7 (6.3) 26.7 5.1 21.6 100.0 53.9 46.1 17.3 6.2 22.5 2.9 2.9 0.2 22.8 7.8 15.0 100.0 38.5 61.5 50.5 2.0 9.0 0.3 0.0 0.0 9.2 3.5 5.8 100.0 81.0 19.0 9.7 0.7 8.6 0.4 0.0 0.0 9.0 2.8 6.2 100.0 70.9 29.1 23.1 1.8 4.2 0.7 0.0 (0.3) 4.6 1.3 3.3 (0.7) 6.2 0.3 1.5 0.1 5.1 (3.4) 8.5 EXHIBIT 1 | Common-Sized Financial Data and Ratios (Continued) F G 1.70 27.32 1.05 41.85 5.13 0.00 nmt 0.00 2.63 2.43 1.57 nmt Market Data A B D E Beta 0.65 0.85 0.55 0.60 1.20 Price/Earnings 22.29 22.32 16.85 19.73 30.48 Price to Book 5.93 3.08 13.99 2.56 17.46 Dividend Payout 38.21 46.28 33.16 0.00 0.00 Liquidity Current Ratio 1.96 1.50 0.92 3.35 1.20 Quick Ratio 1.42 1.13 0.47 2.77 1.01 Asset Management Inventory Tumover 3.08 0.93 12.60 7.44 67.96 Receivables Tumover 7.06 5.47 21.87 18.68 12.23 Fixed Assets Turnover 4.67 2.86 1.72 12.67 30.68 Debt Management Total Debt/Total Assets 5.34 14.99 51.119 0.00 2.18 LT DebtShareholders' Equity 8.06 10.66 310.28 0.00 7.79 Interest Coverage After Tax 27.34 32.57 nmf 191.19 DuPont Analysis Net Profit Margin 17.97 21.58 15.00 5.76 6.18 Asset Turnover 0.93 0.44 0.97 2.23 2.31 Return on Equity 26.75 16.64 83.97 15.95 46.92 Sources of data: S&P's Research Insight; Value Line Investment Survey nmf = not a meaningful figure. 74.78 8.28 12.03 13.56 nmt 29.42 0.00 0.00 93.00 56.94 nmt 6.49 6.25 3.33 1.11 5.44 8.50 2.56 nmt EXHIBIT 1 | Common-Sized Financial Data and Ratios B C D E E F G Assets Cash & Short-Term Investments Receivables Inventories Current Assets-Other Current Assets-Total Net Fixed Assets Assets-Other Intangibles Investments & Advances Assets-Total Liabilities & Equity 24.2 12.8 7.0 7.2 51.2 19.6 6.9 22.2 0.1 100.0 16.1 8.1 5.4 2.5 32.1 14.9 3.8 46.1 3.1 100.0 1.4 4.3 4.3 1.3 11.2 54.7 55.6 11.9 11.7 24 81.7 16.0 1.0 1.3 0.0 100.0 42.2 19.0 2.0 9.5 72.8 7.3 1.3 0.0 18.6 100.0 67.9 13.0 1.3 5.5 87.6 8.8 2.4 1.2 0.0 100.0 54.8 nmt 14.8 8.6 78.2 7.6 9.3 7.2 7.4 2.9 100.0 0.0 100.0 1.7 2.2 9.1 1.6 8.5 21.4 5.9 10.2 7.3 44.8 55.2 100.0 7.4 9.1 38.3 0.0 0.0 0.0 0.9 0.0 3.8 13.7 22.6 12.2 24.4 60.9 51.2 0.0 2.2 10.7 1.9 0.0 9.5 0.7 8.9 83.5 27.1 72.1 16.5 72.9 27.9 100.0 100.0 100.0 18.0 0.0 0.0 15.3 33.3 0.0 0.0 3.7 36.9 63.1 100.0 35.1 0.1 0.0 14.7 49.9 56.9 nmt 0.2 107.0 (7.0) 100.0 Accounts Payable 9.8 Debt in Current Liabilities 0.5 Income Taxes Payable 2.8 Current Liabilities-Other 13.0 Current Liabilities-Total 26.1 LT Debt 4.8 Deferred Taxes 0.8 Liabilities Other 8.6 Liabilities-Total 40.3 Stockholders' Equity 59.7 Total Liabilities & Equity 100.0 Income/Expenses Sales-Net 100.0 Cost of Goods Sold 23.9 Gross Profit 76.1 SG&A Expense 44.5 Depreciation Earnings Before Interest & Taxes 272 Nonoperating income (Expense) 0.7 Interest Income (Expense) Special Items-Income (Expense) (0.0) Pretax Income 27.1 Income Taxes-Total 9.1 Net Income (Loss) 18.0 100.0 75.8 24.2 16.9 4.5 100.0 11.1 88.9 46.7 9.7 32.5 1.1 0.7 (6.3) 26.7 5.1 21.6 100.0 53.9 46.1 17.3 6.2 22.5 2.9 2.9 0.2 22.8 7.8 15.0 100.0 38.5 61.5 50.5 2.0 9.0 0.3 0.0 0.0 9.2 3.5 5.8 100.0 81.0 19.0 9.7 0.7 8.6 0.4 0.0 0.0 9.0 2.8 6.2 100.0 70.9 29.1 23.1 1.8 4.2 0.7 0.0 (0.3) 4.6 1.3 3.3 (0.7) 6.2 0.3 1.5 0.1 5.1 (3.4) 8.5