Question: Task 1 Print Computing the Limit of a Difference Quotient In this activity, you will compute the limit of a difference quotient to determine the
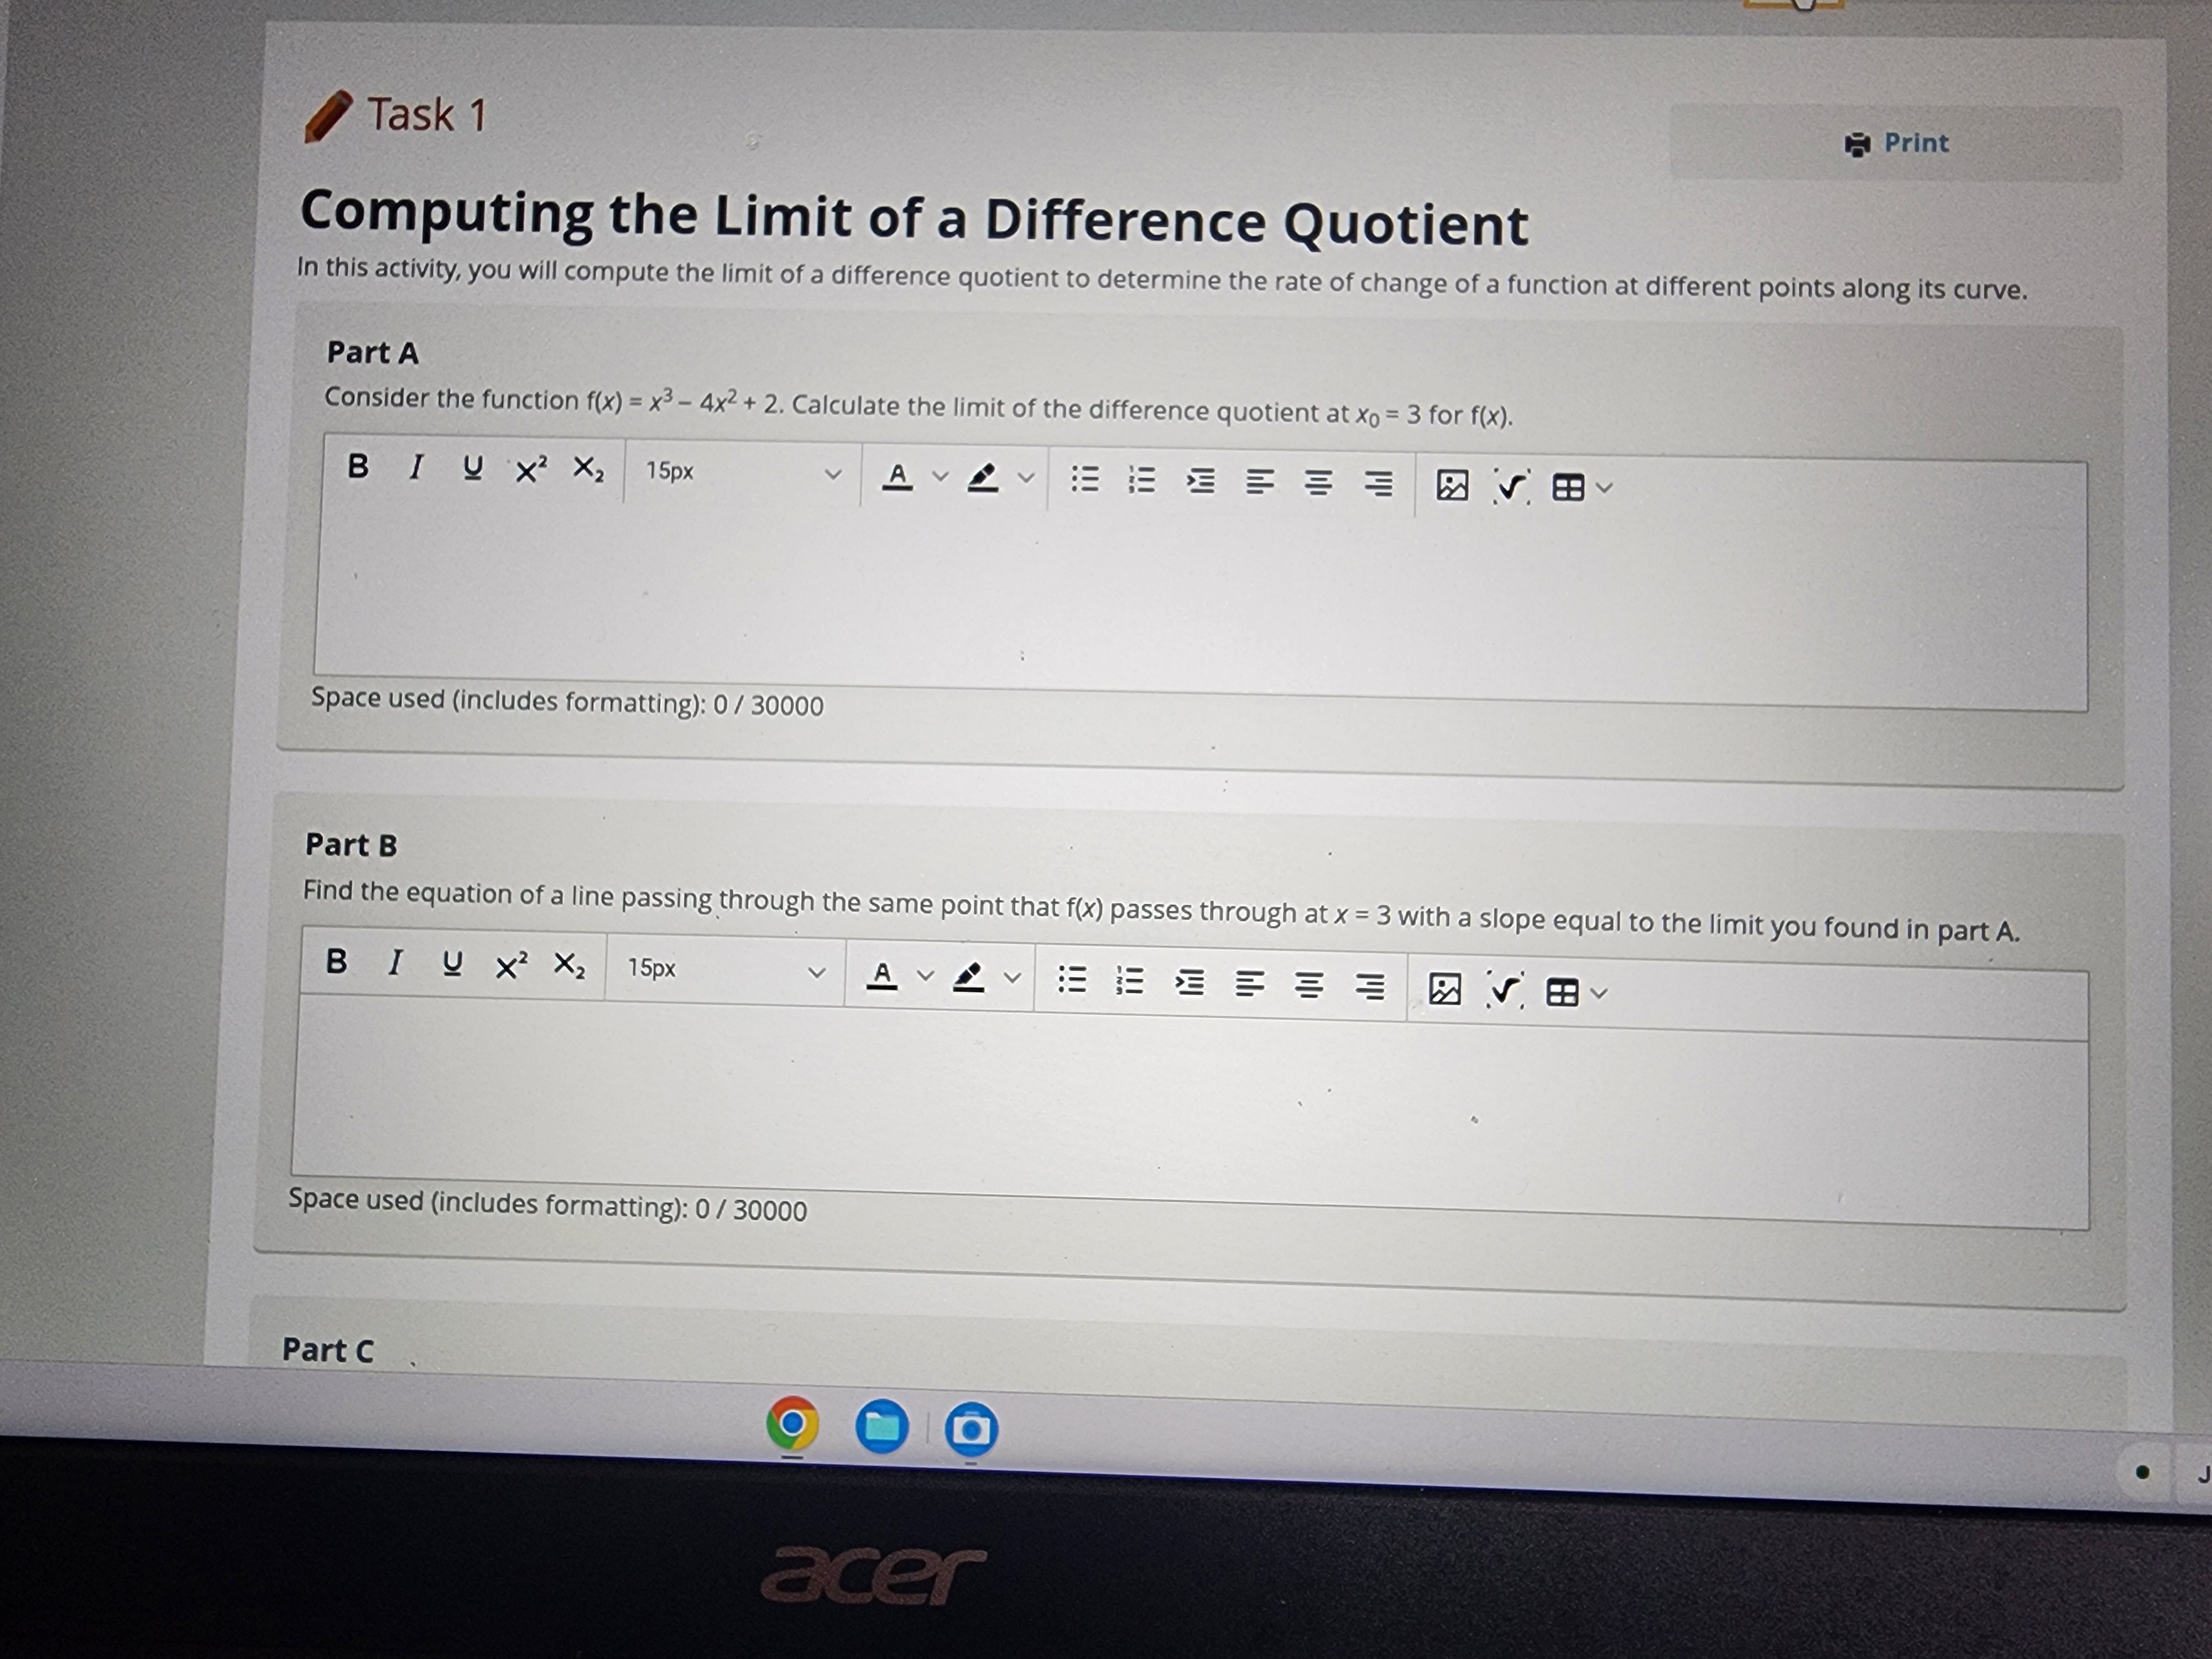
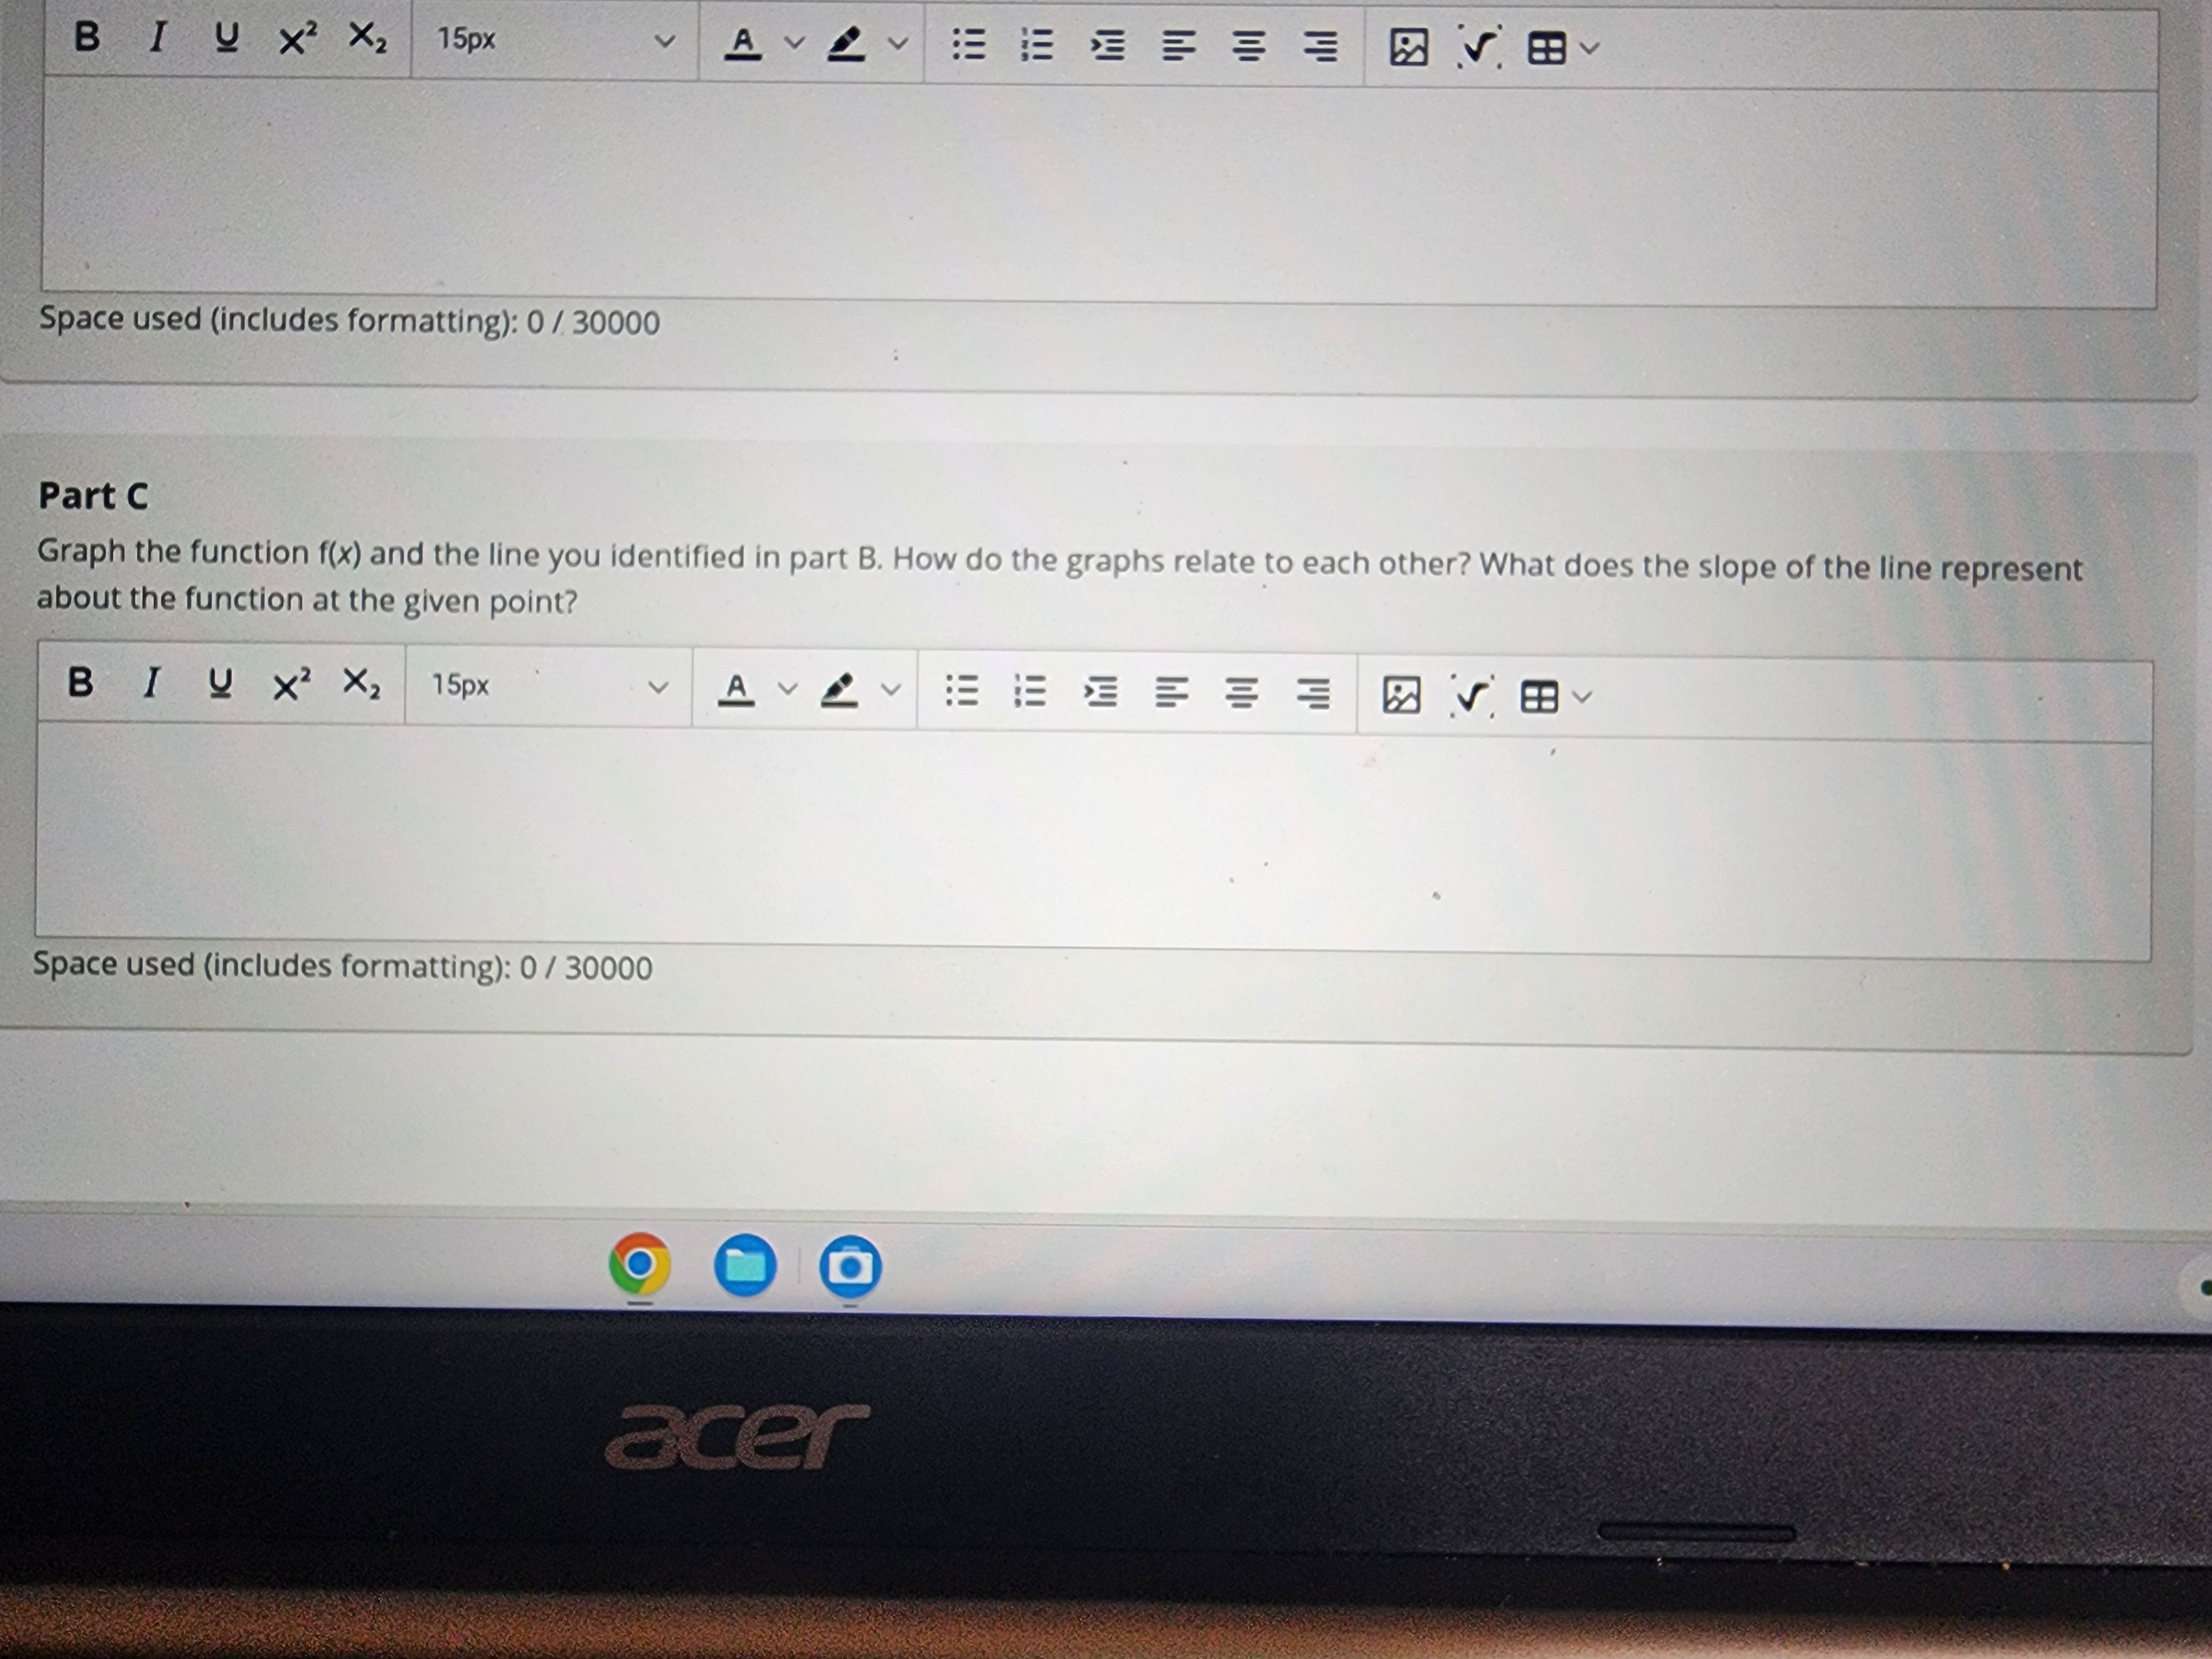
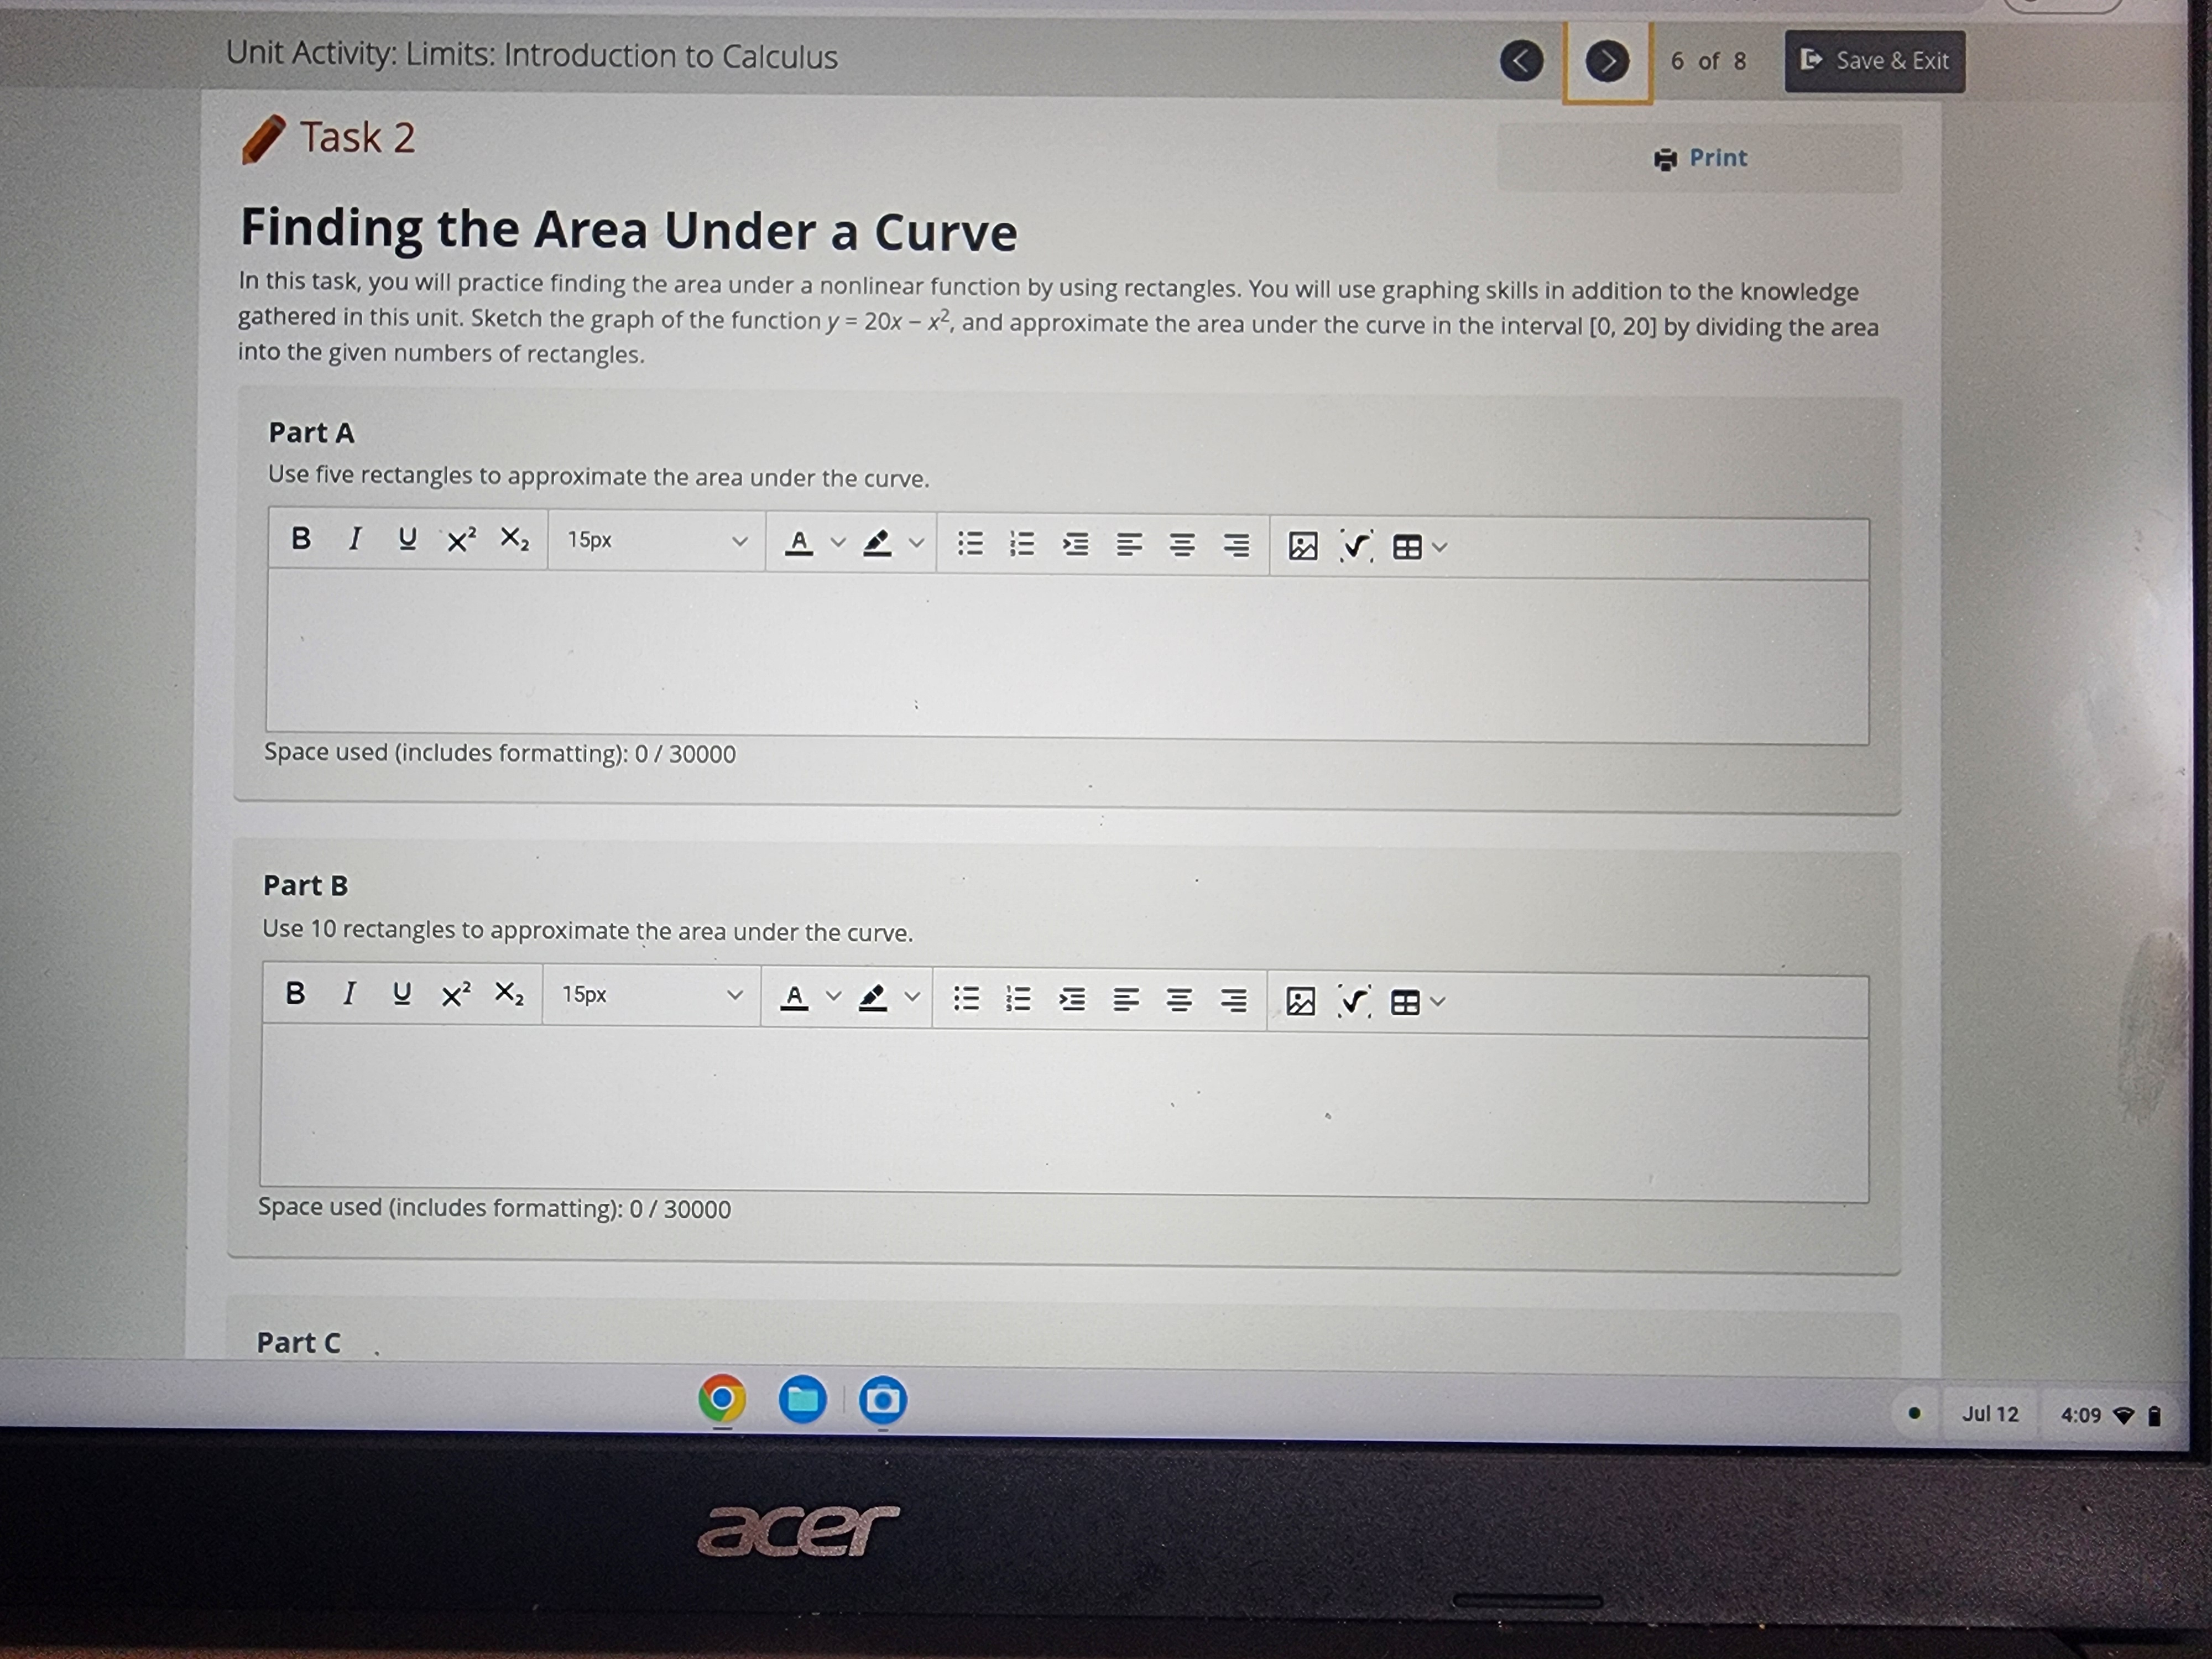
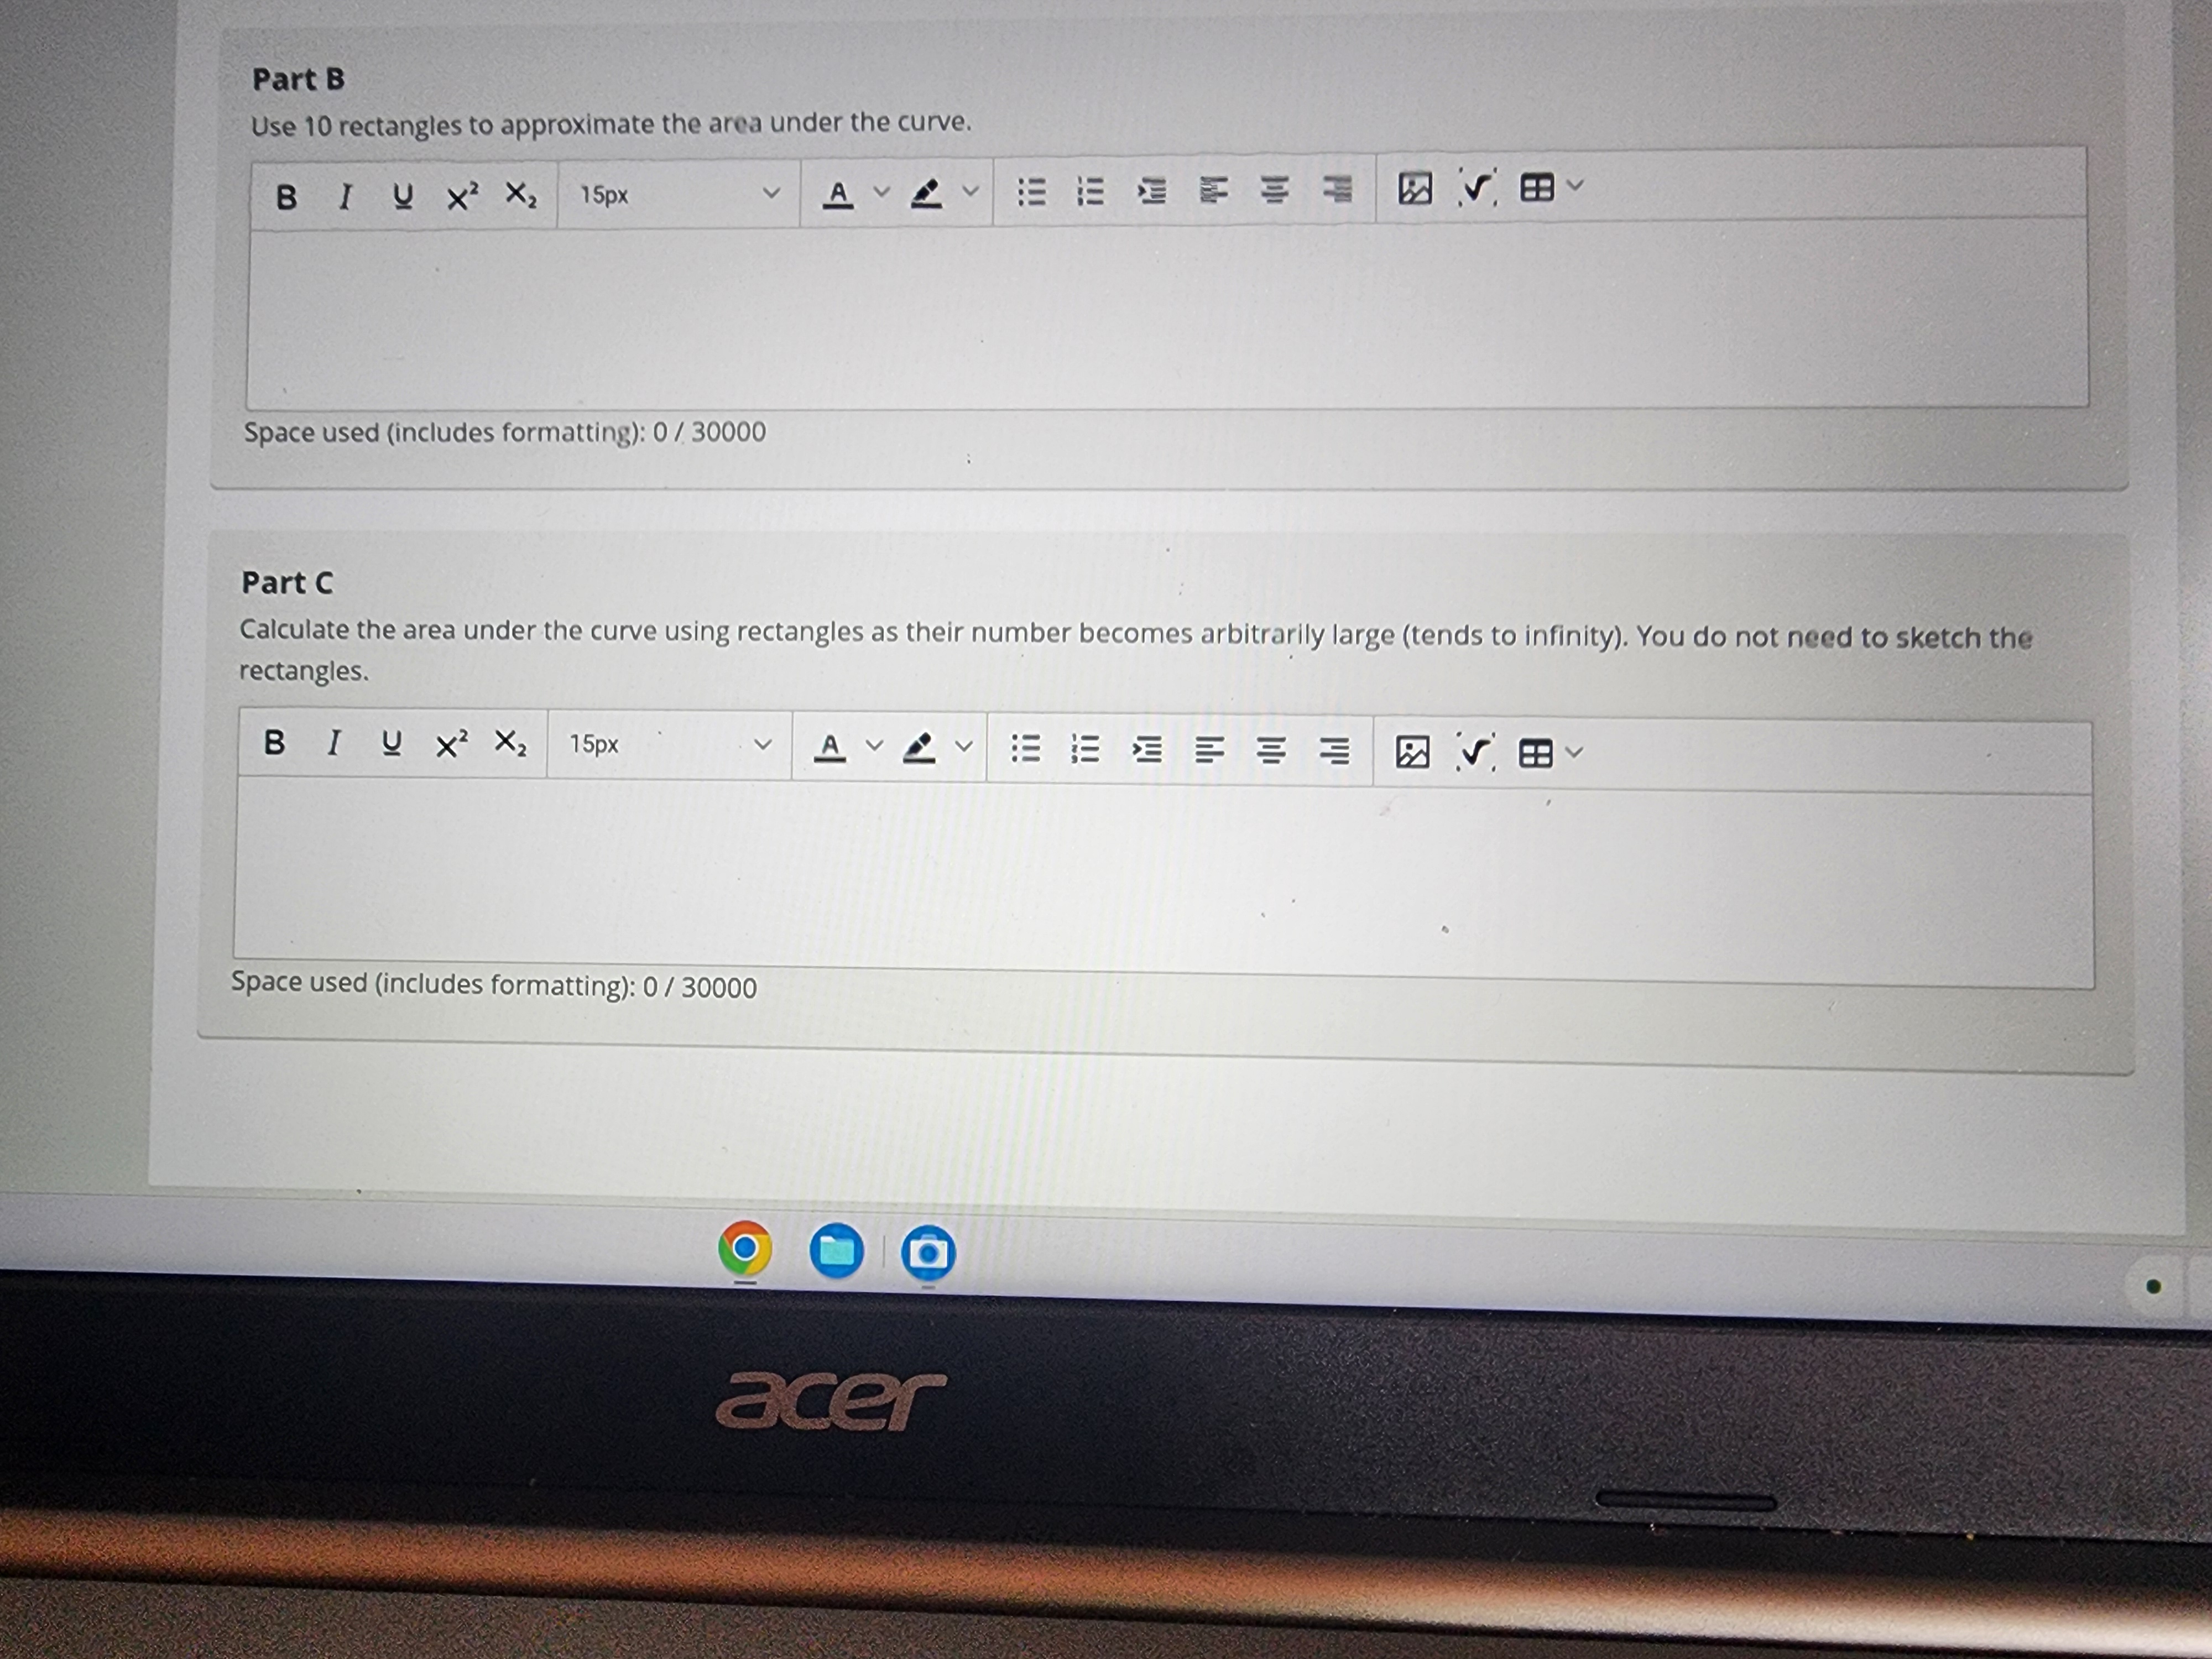
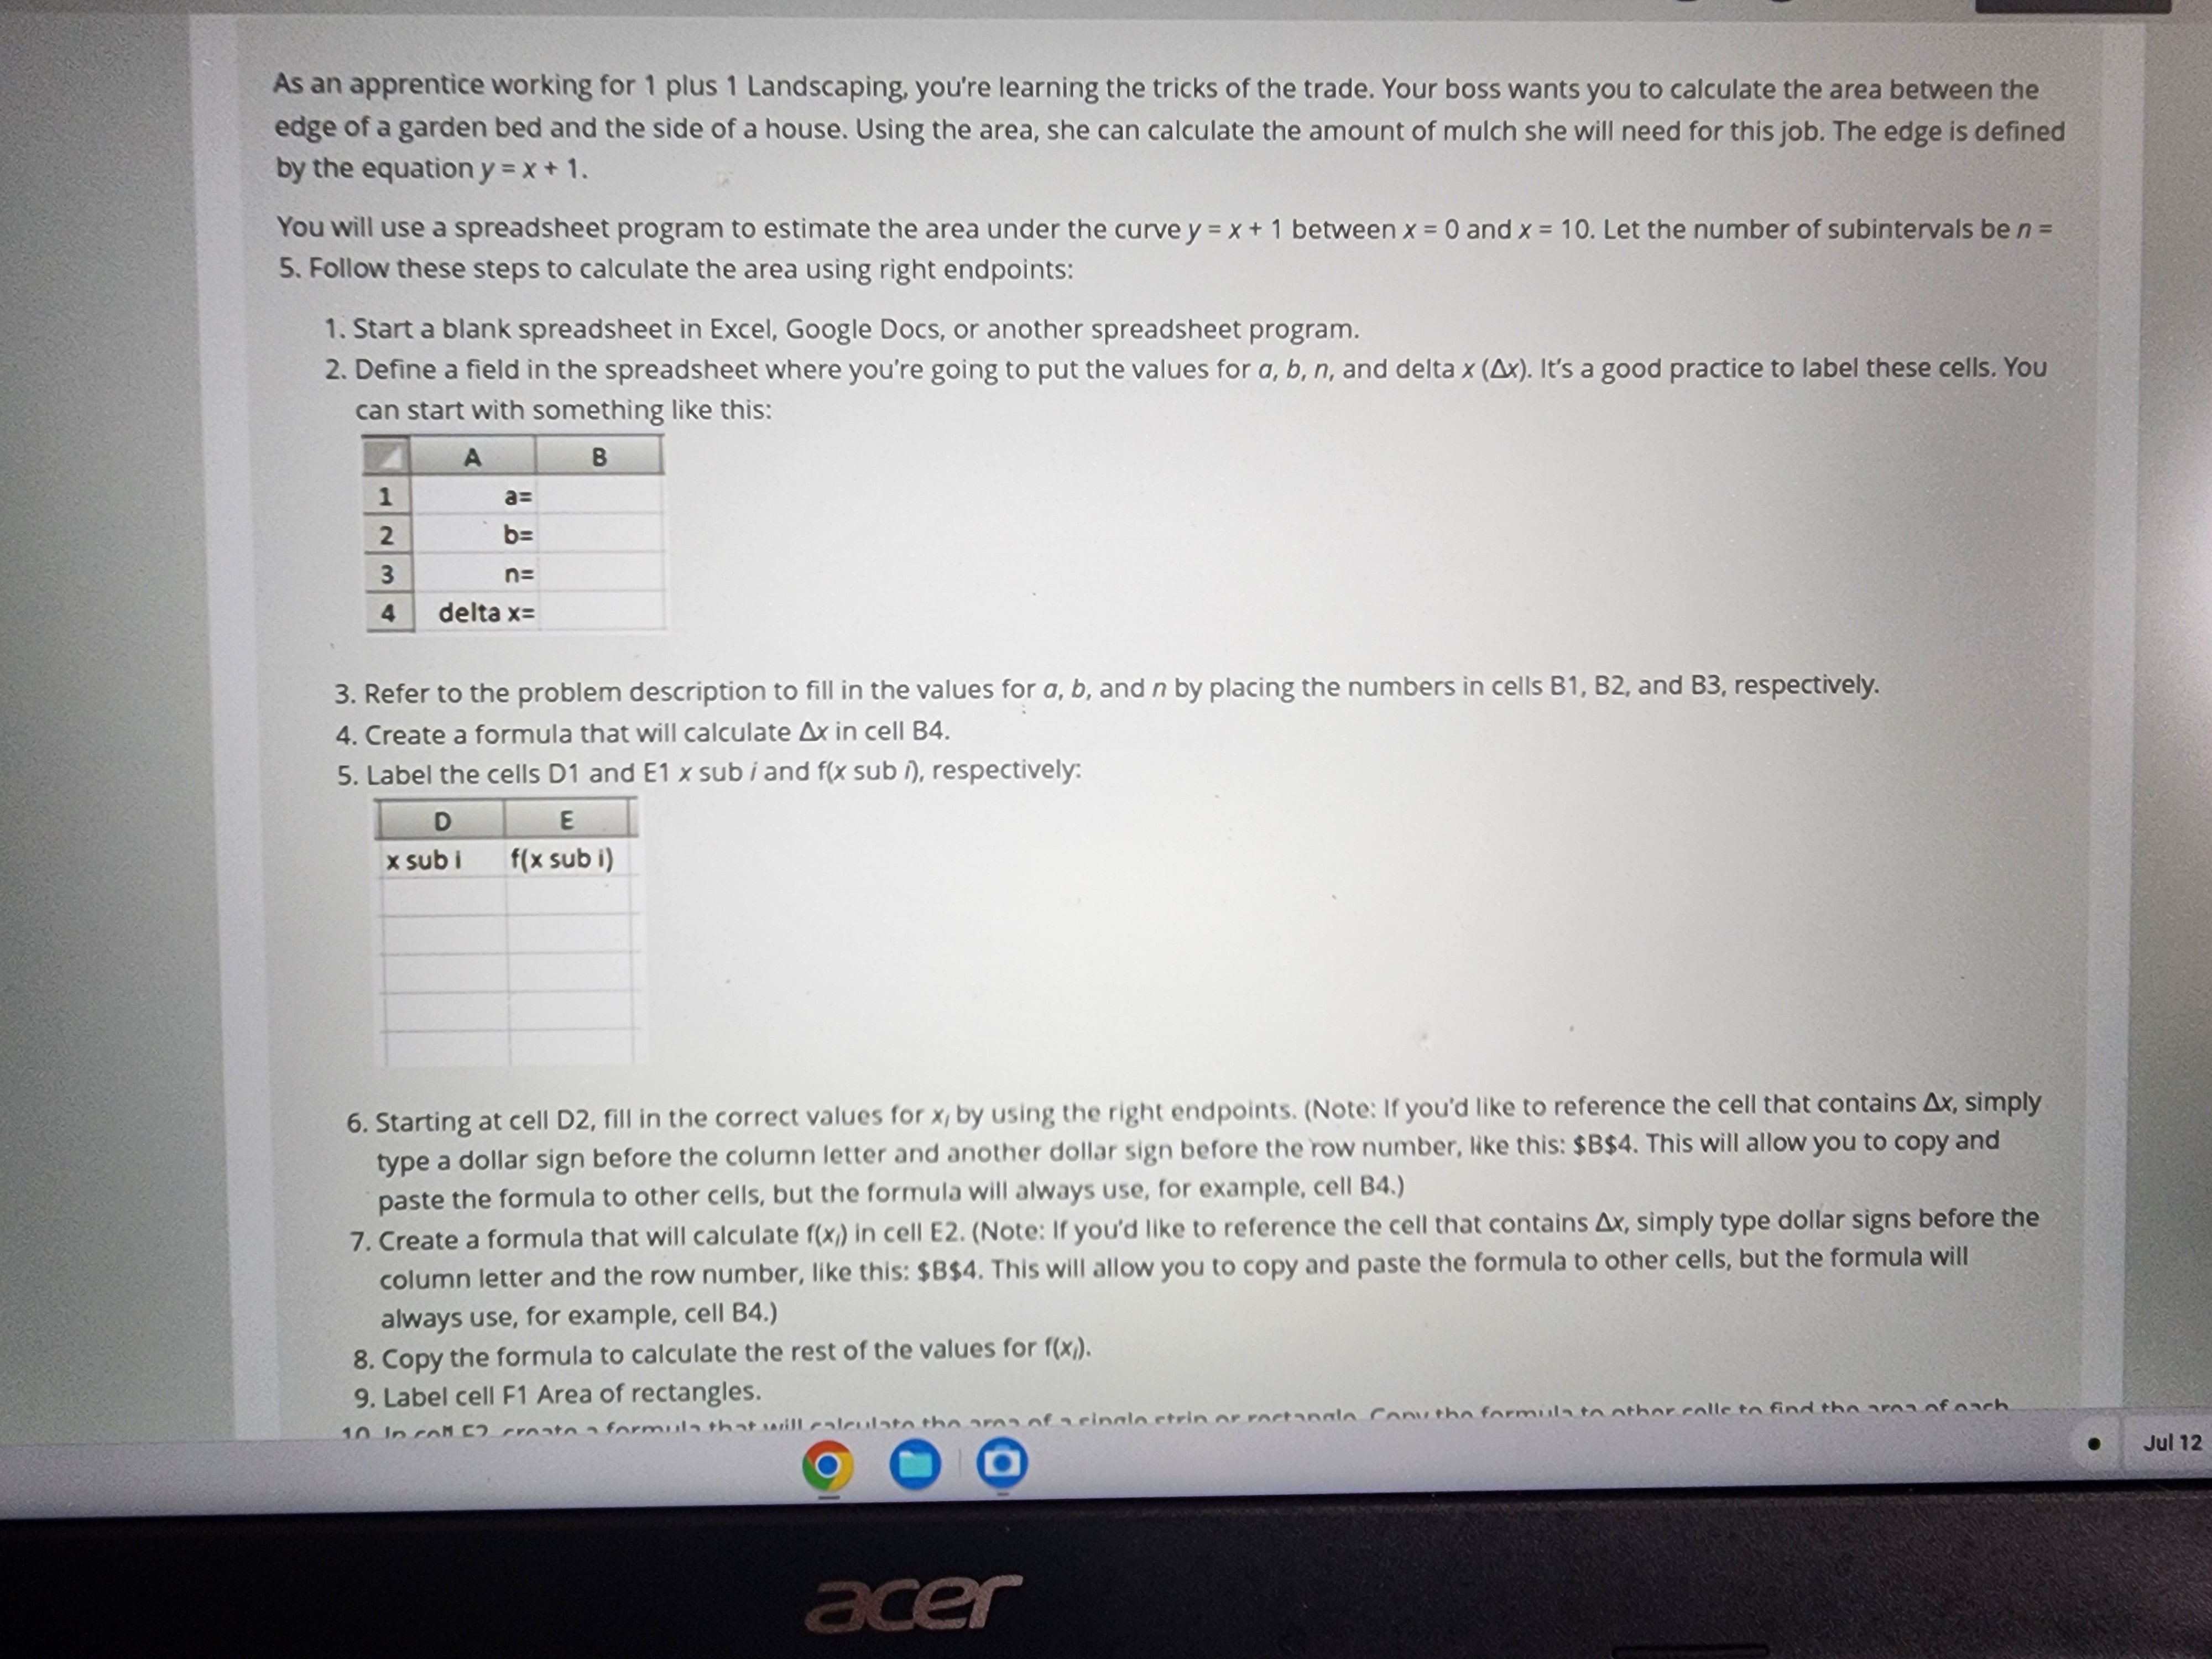
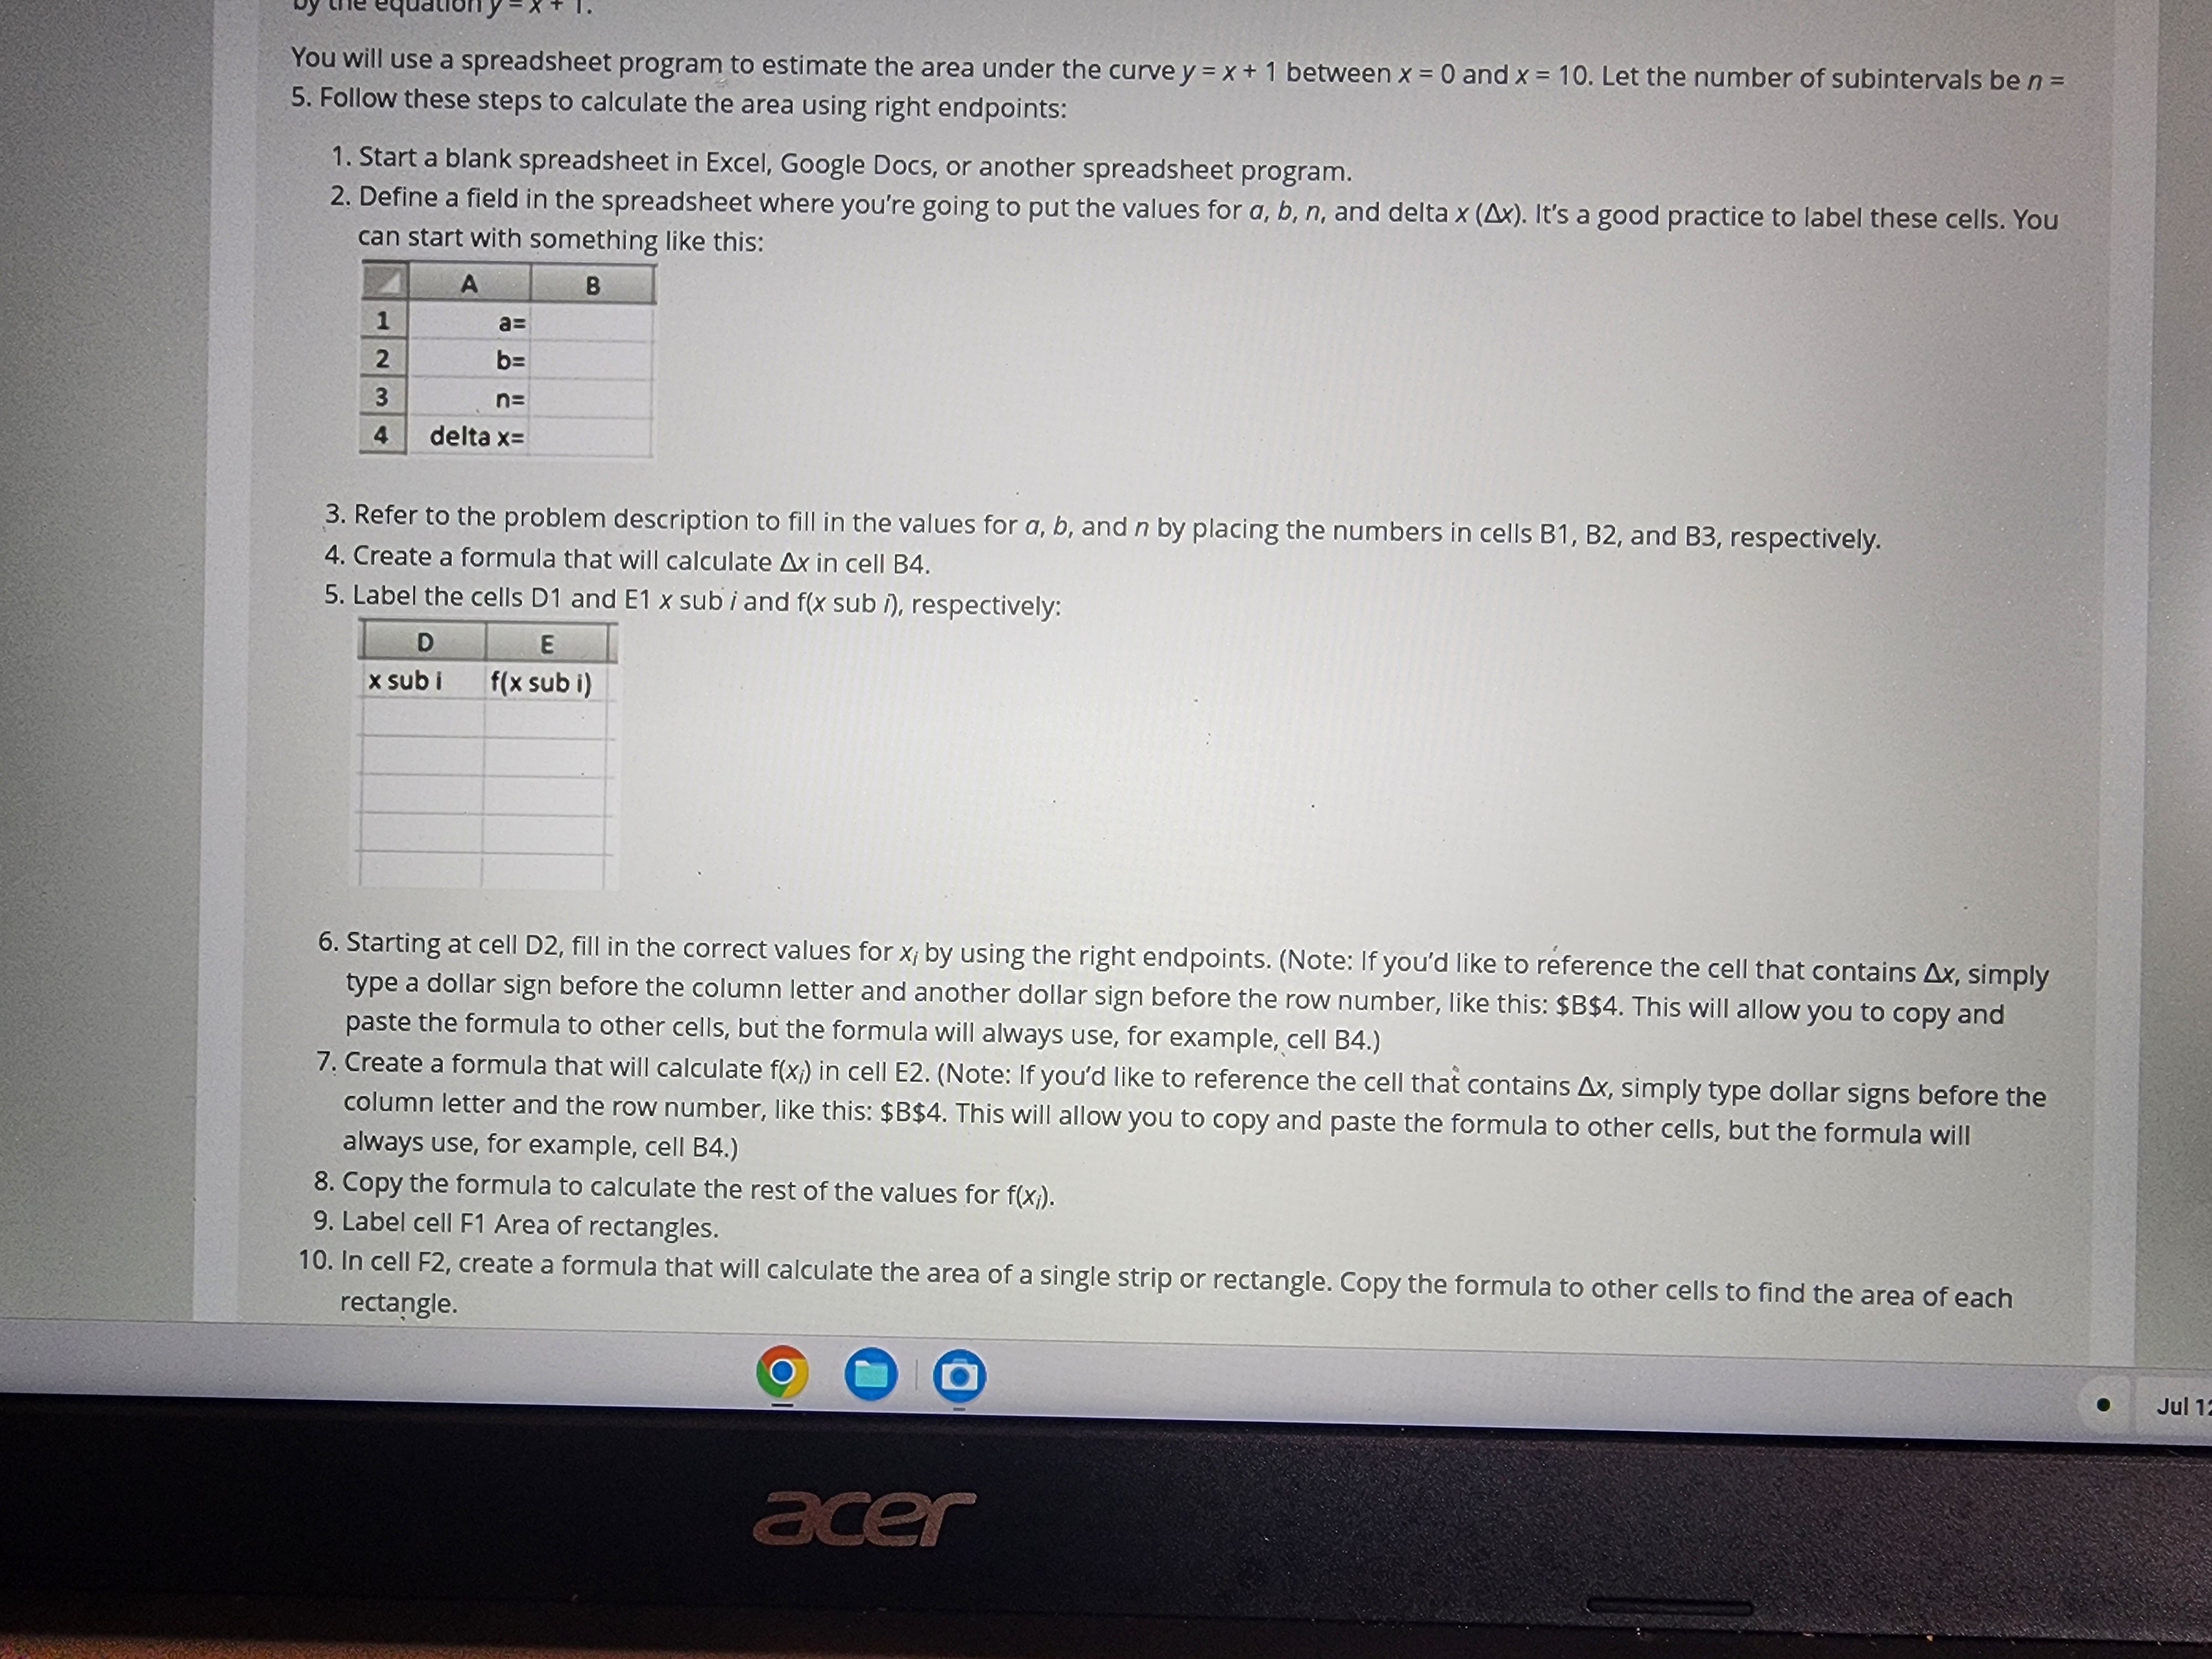
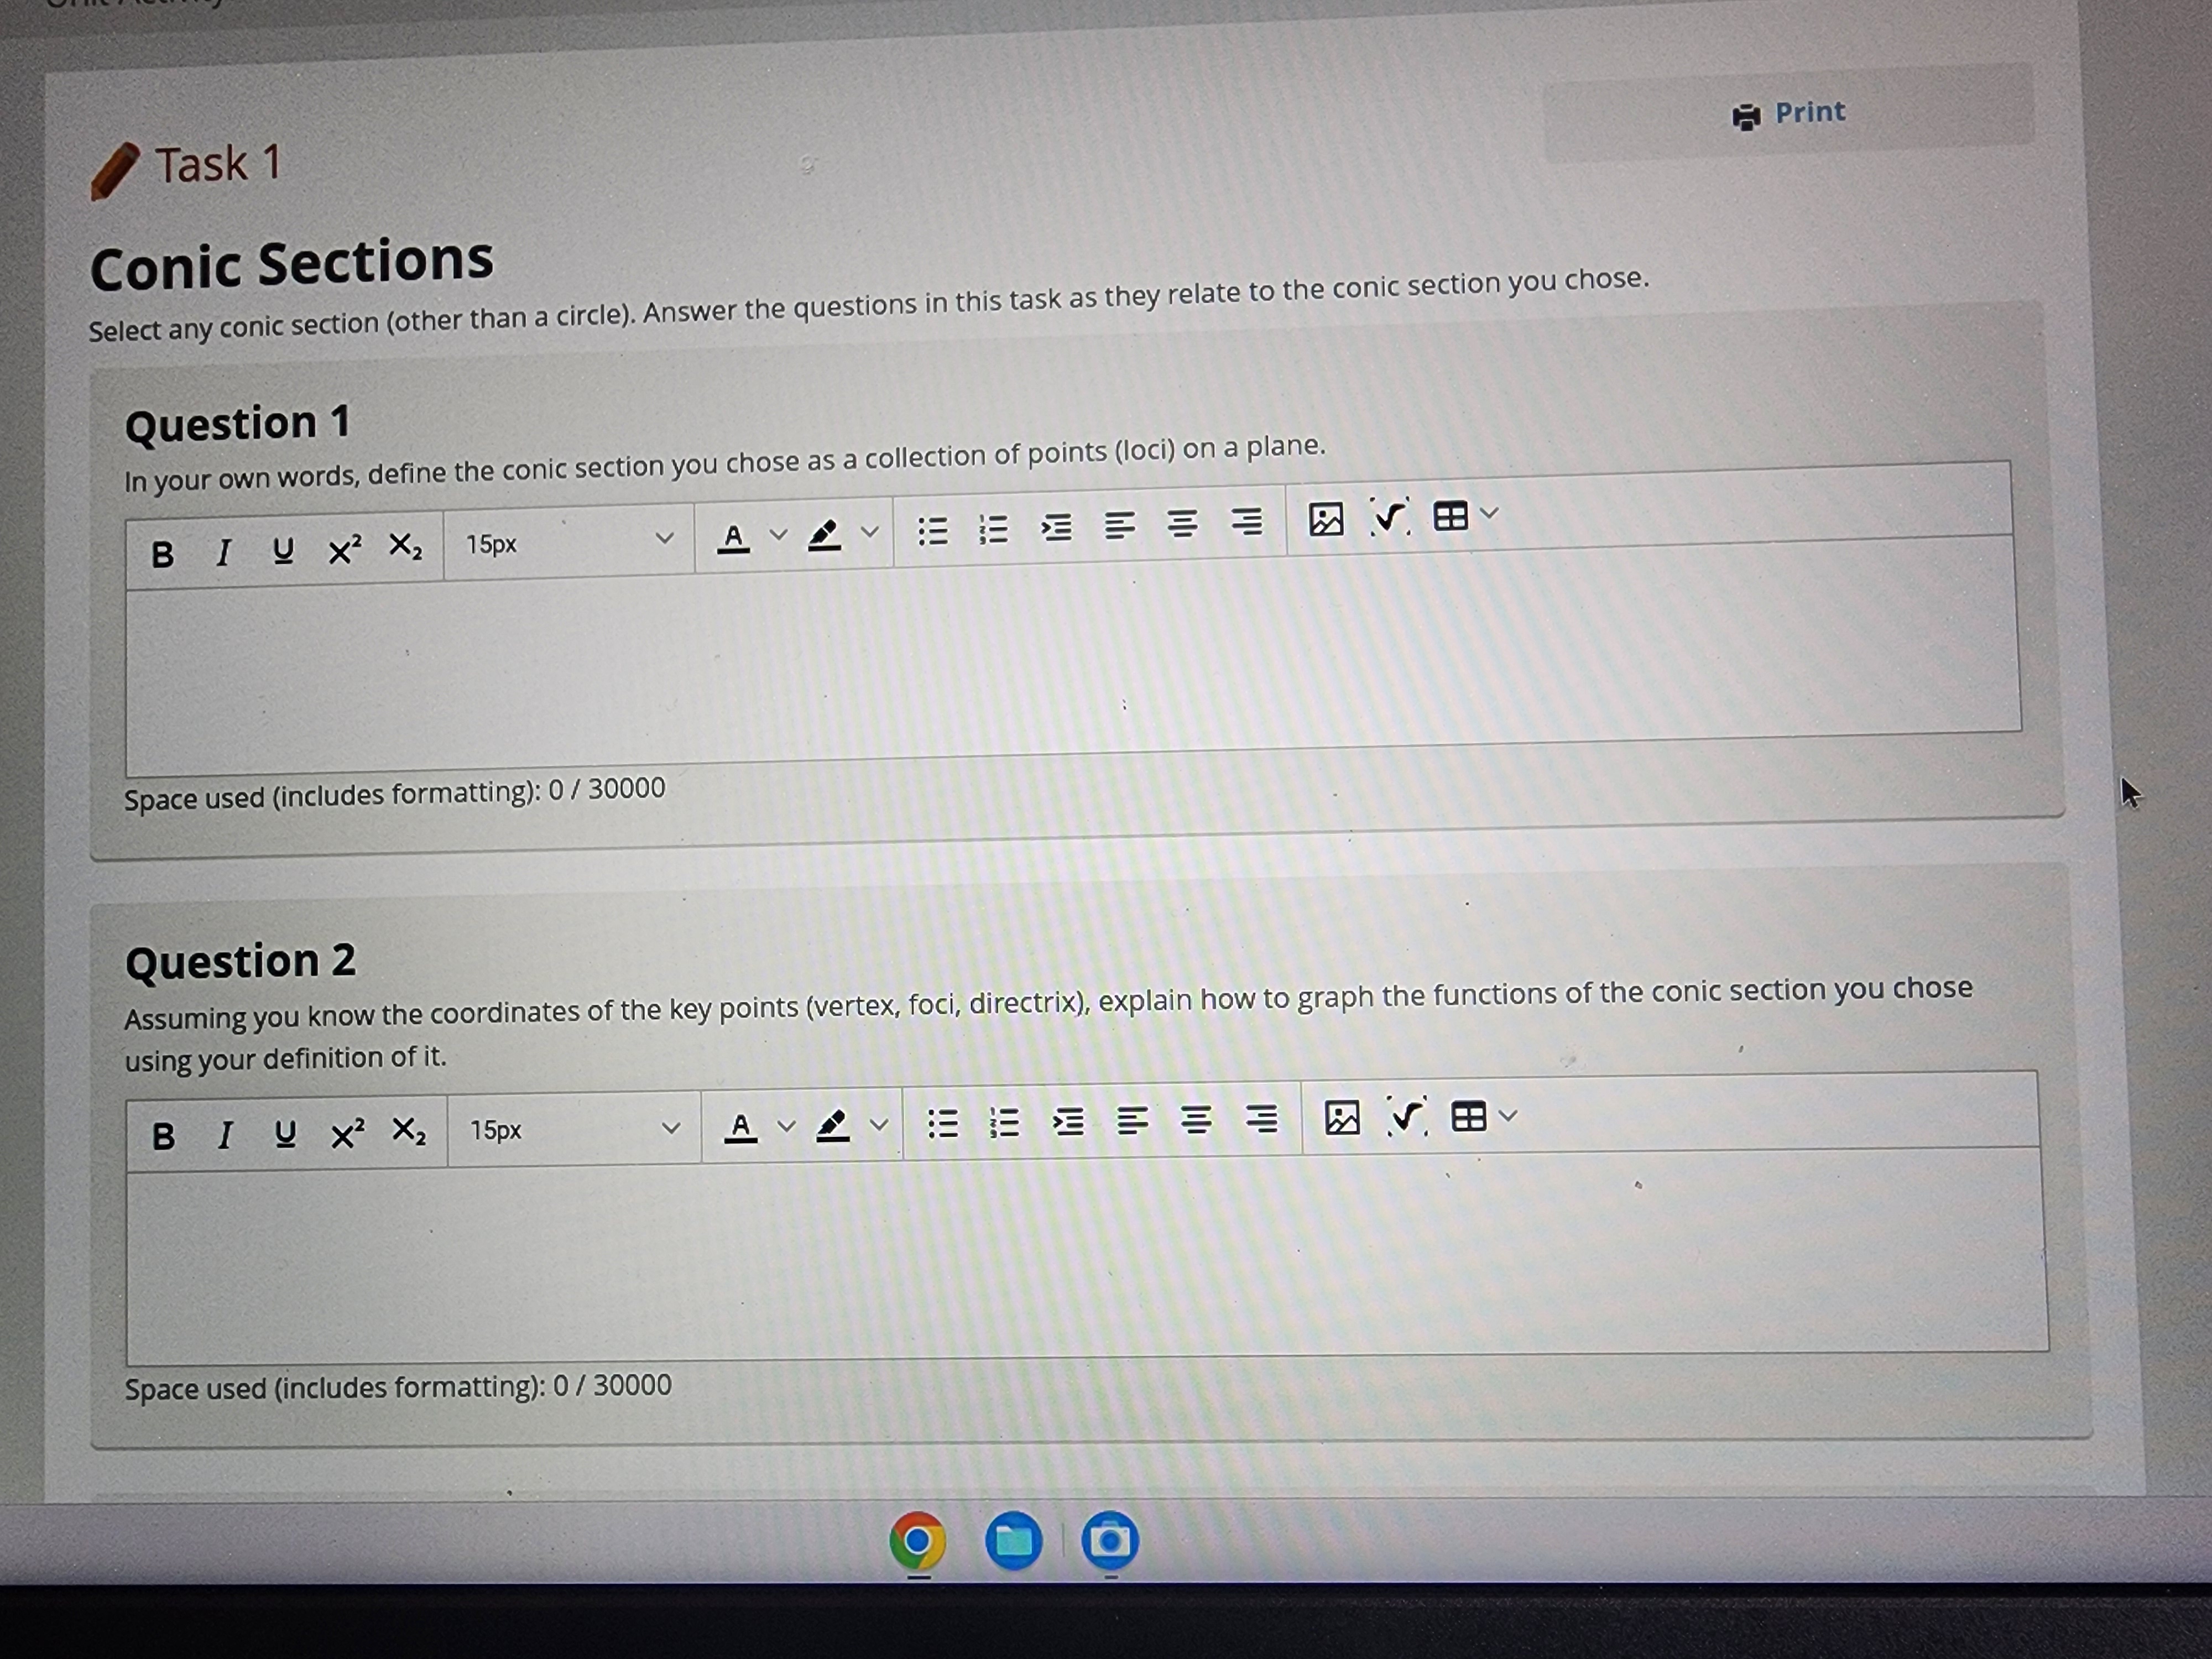
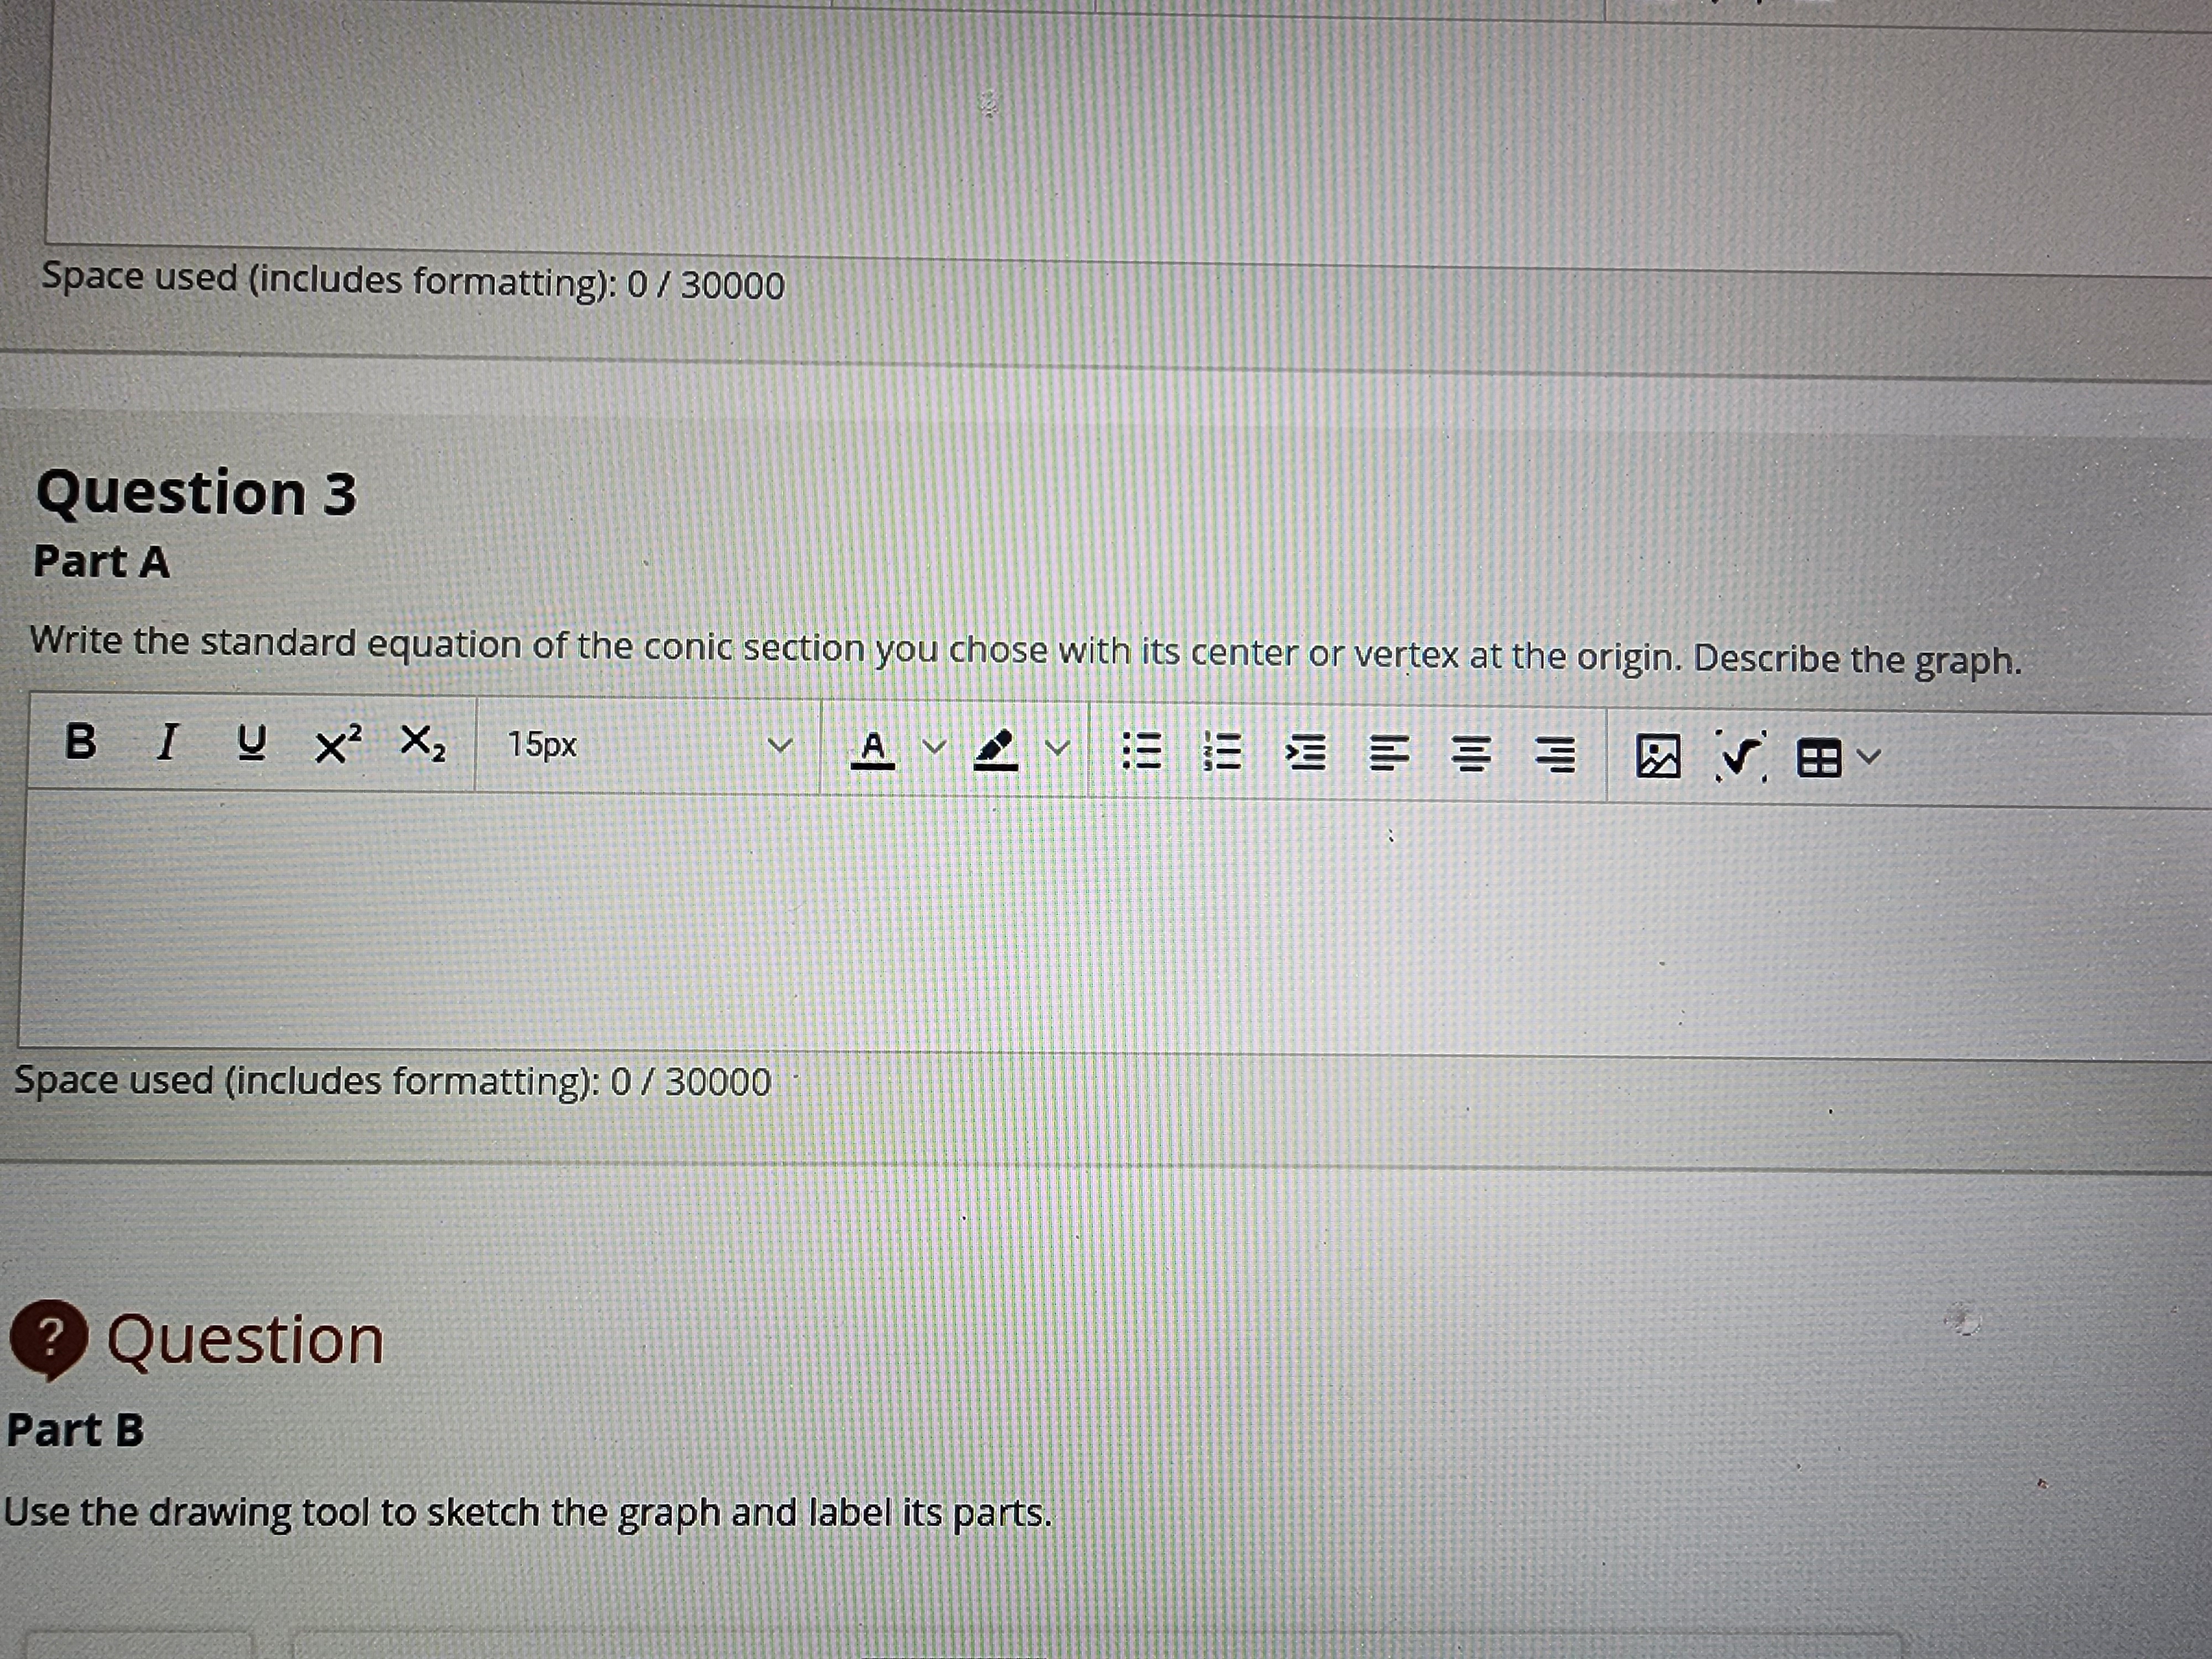
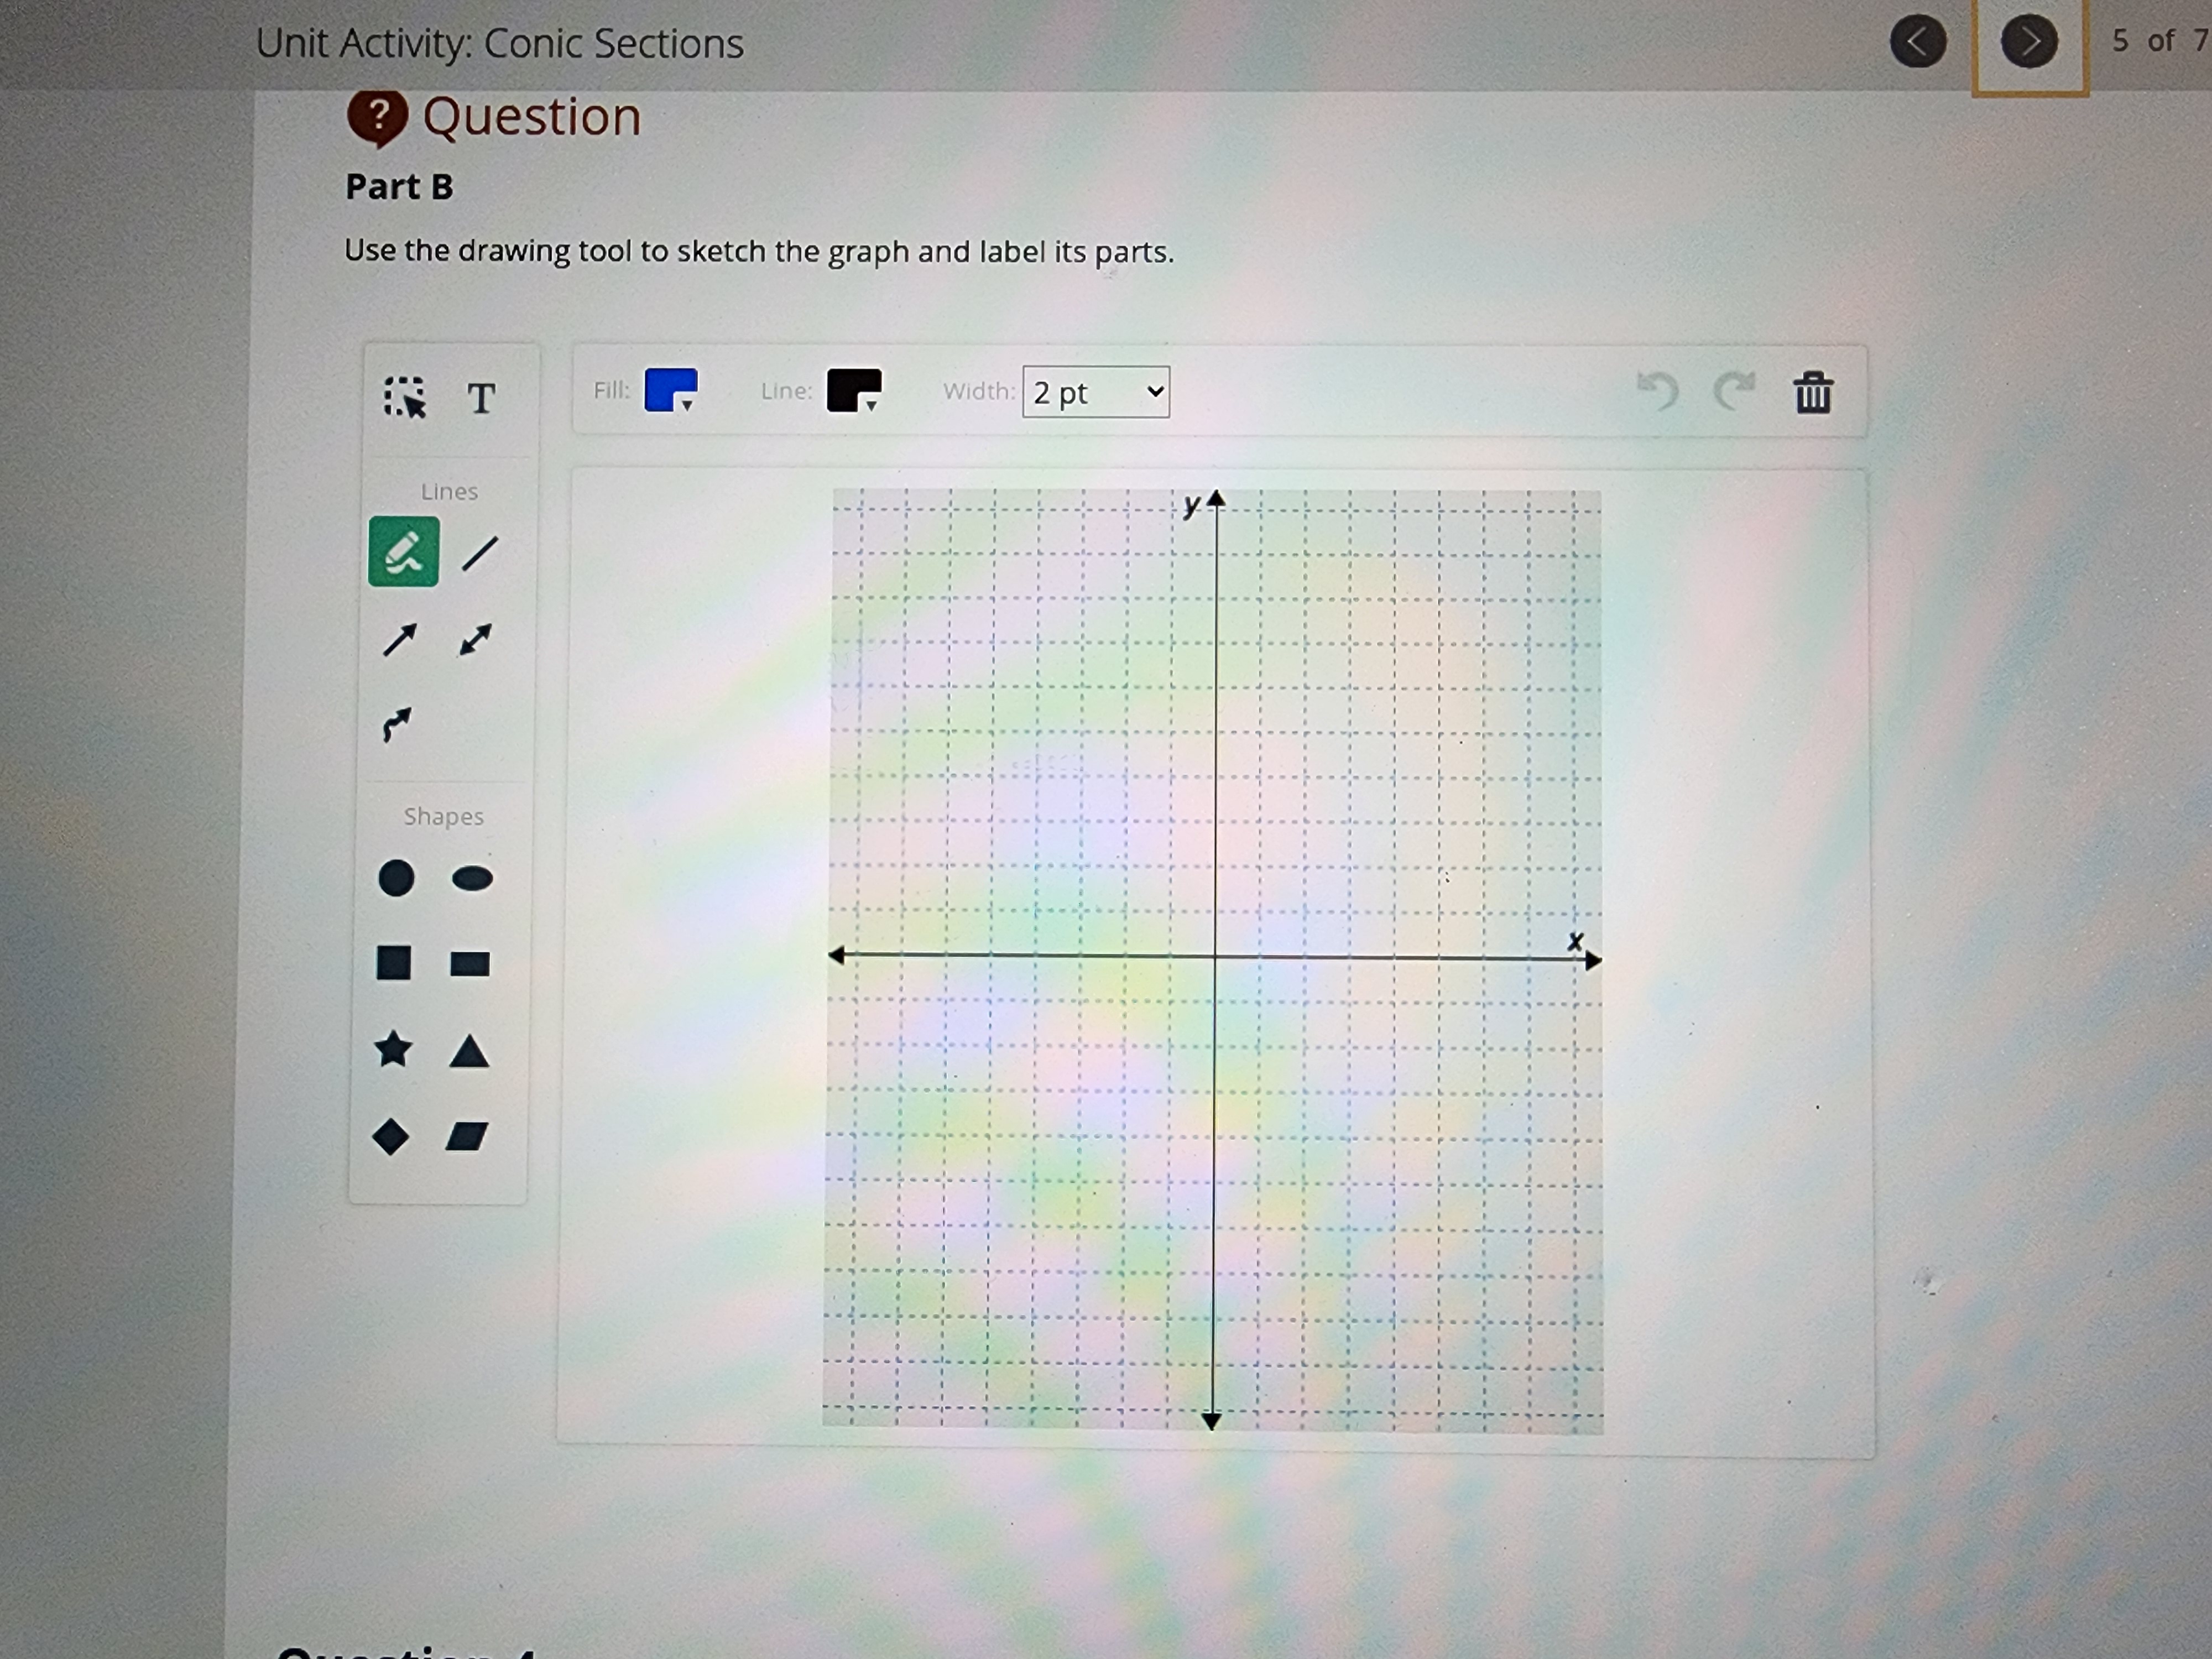
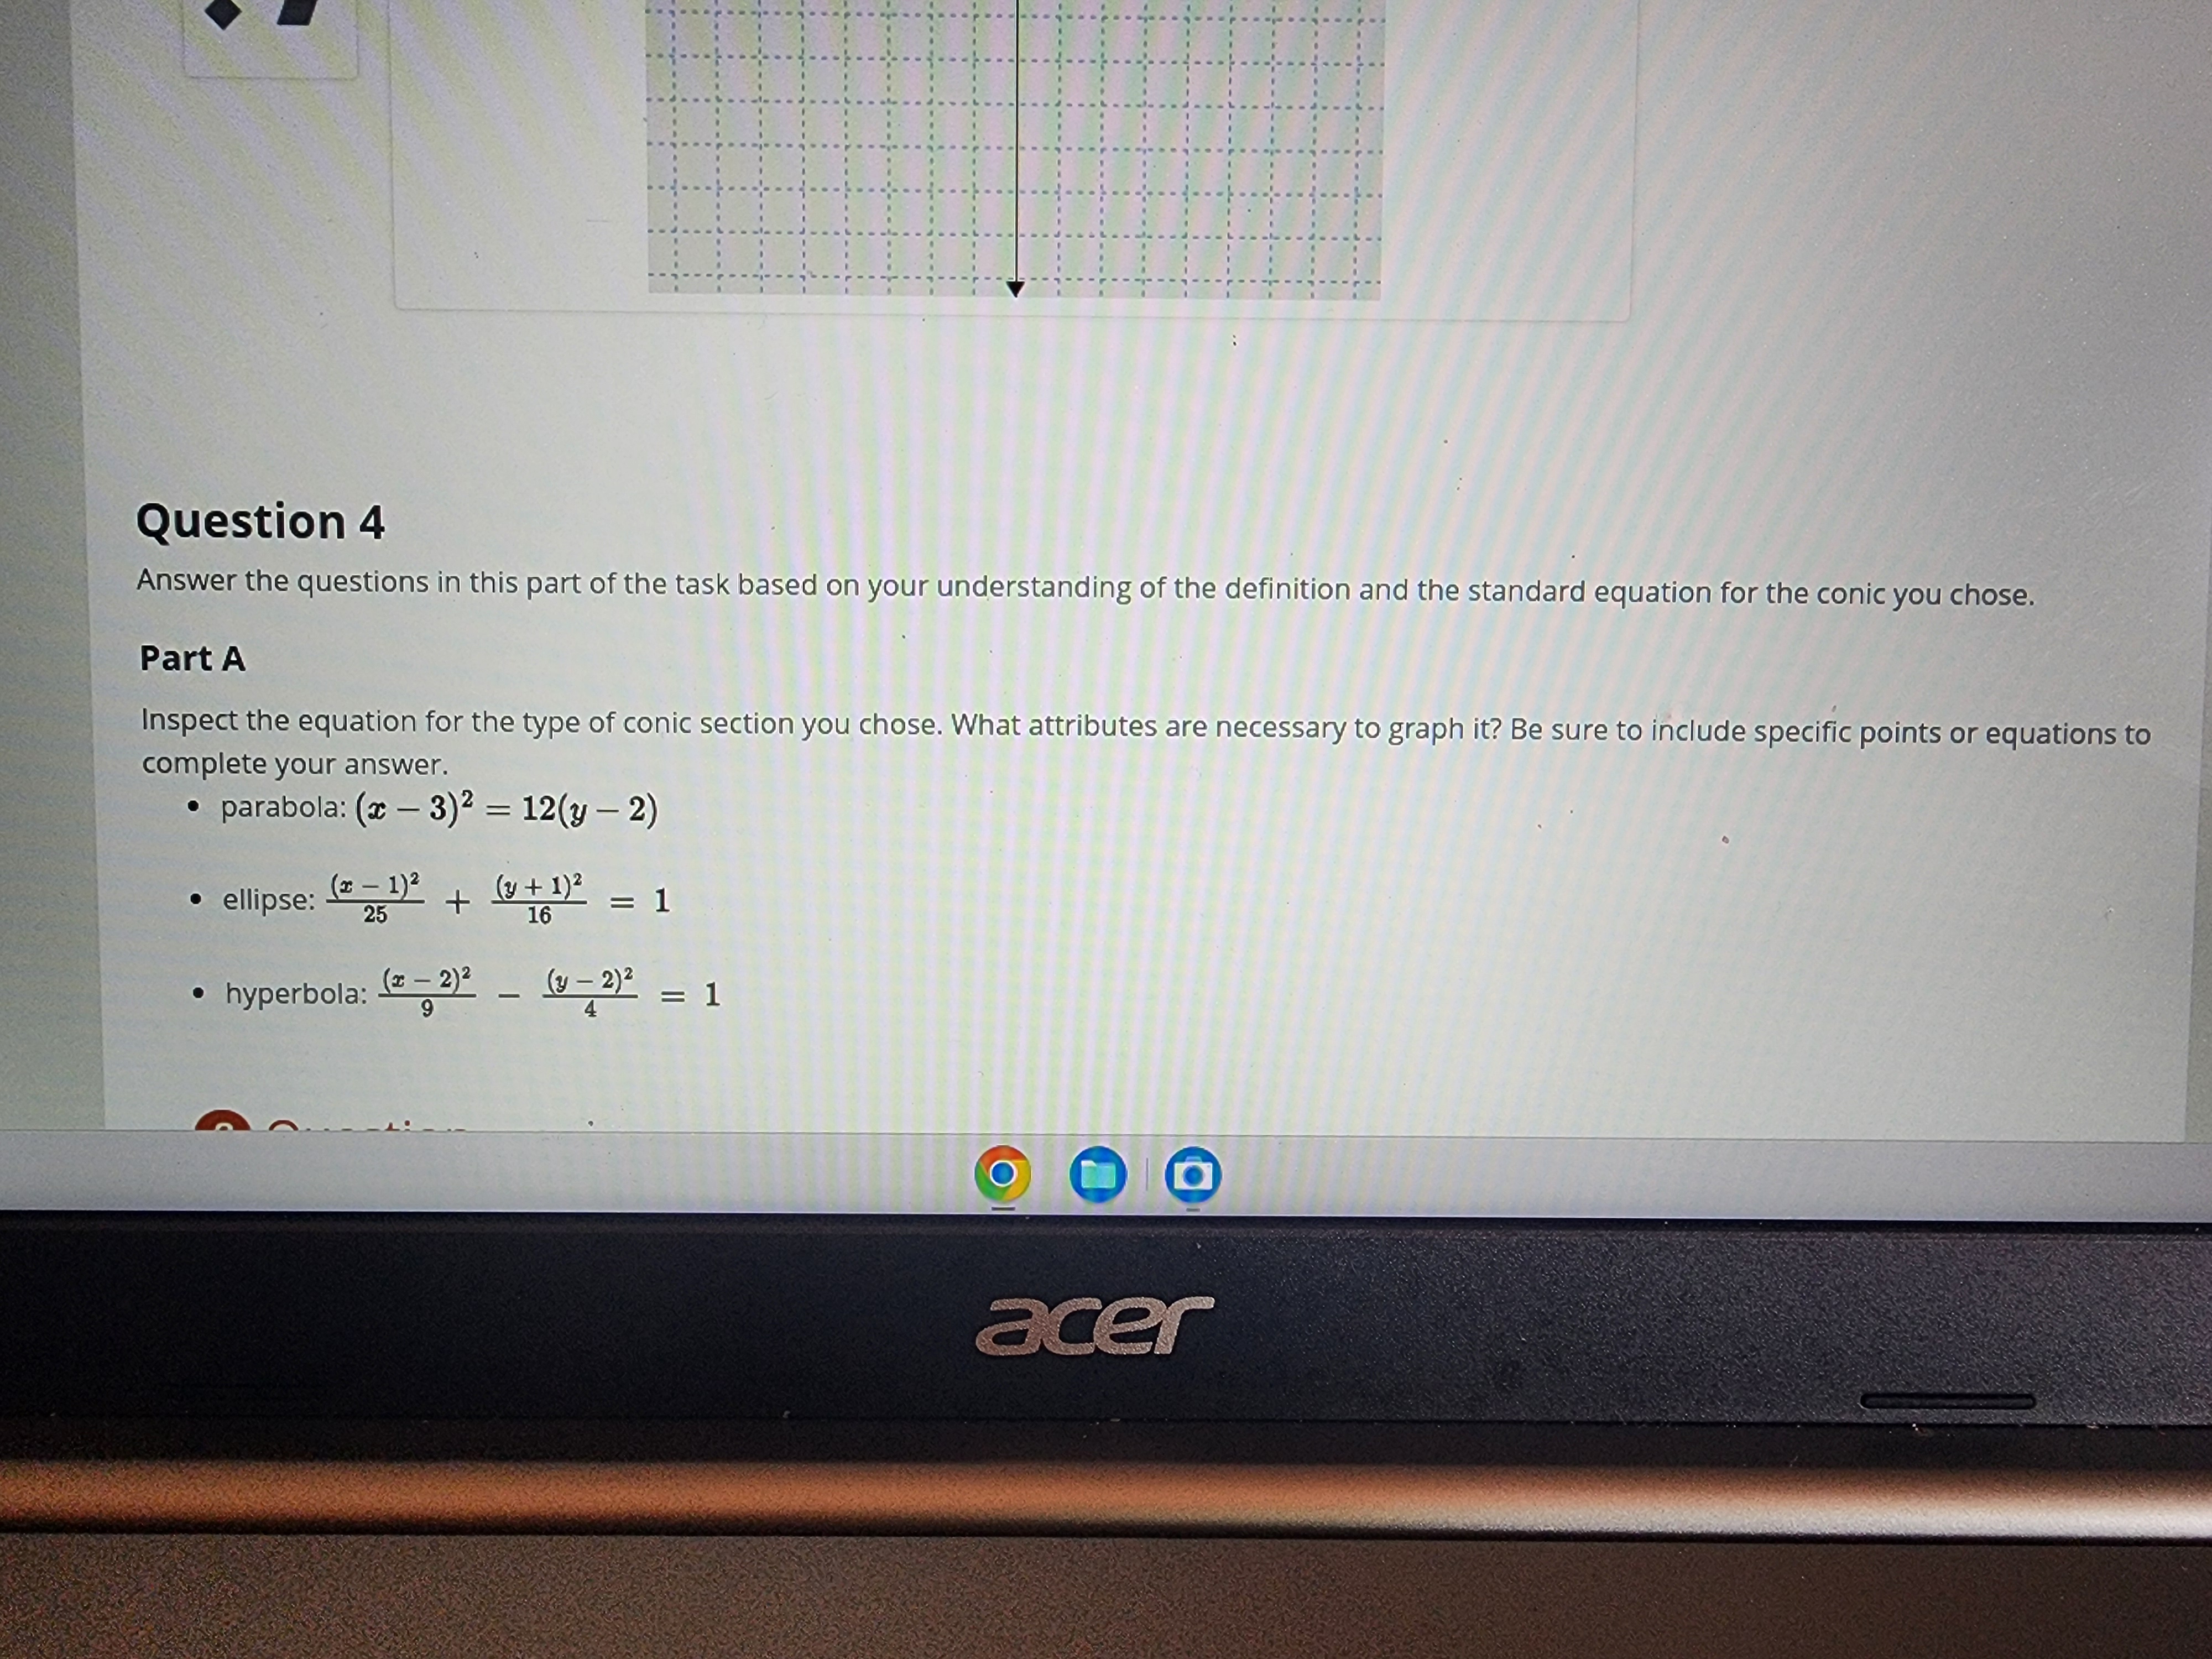
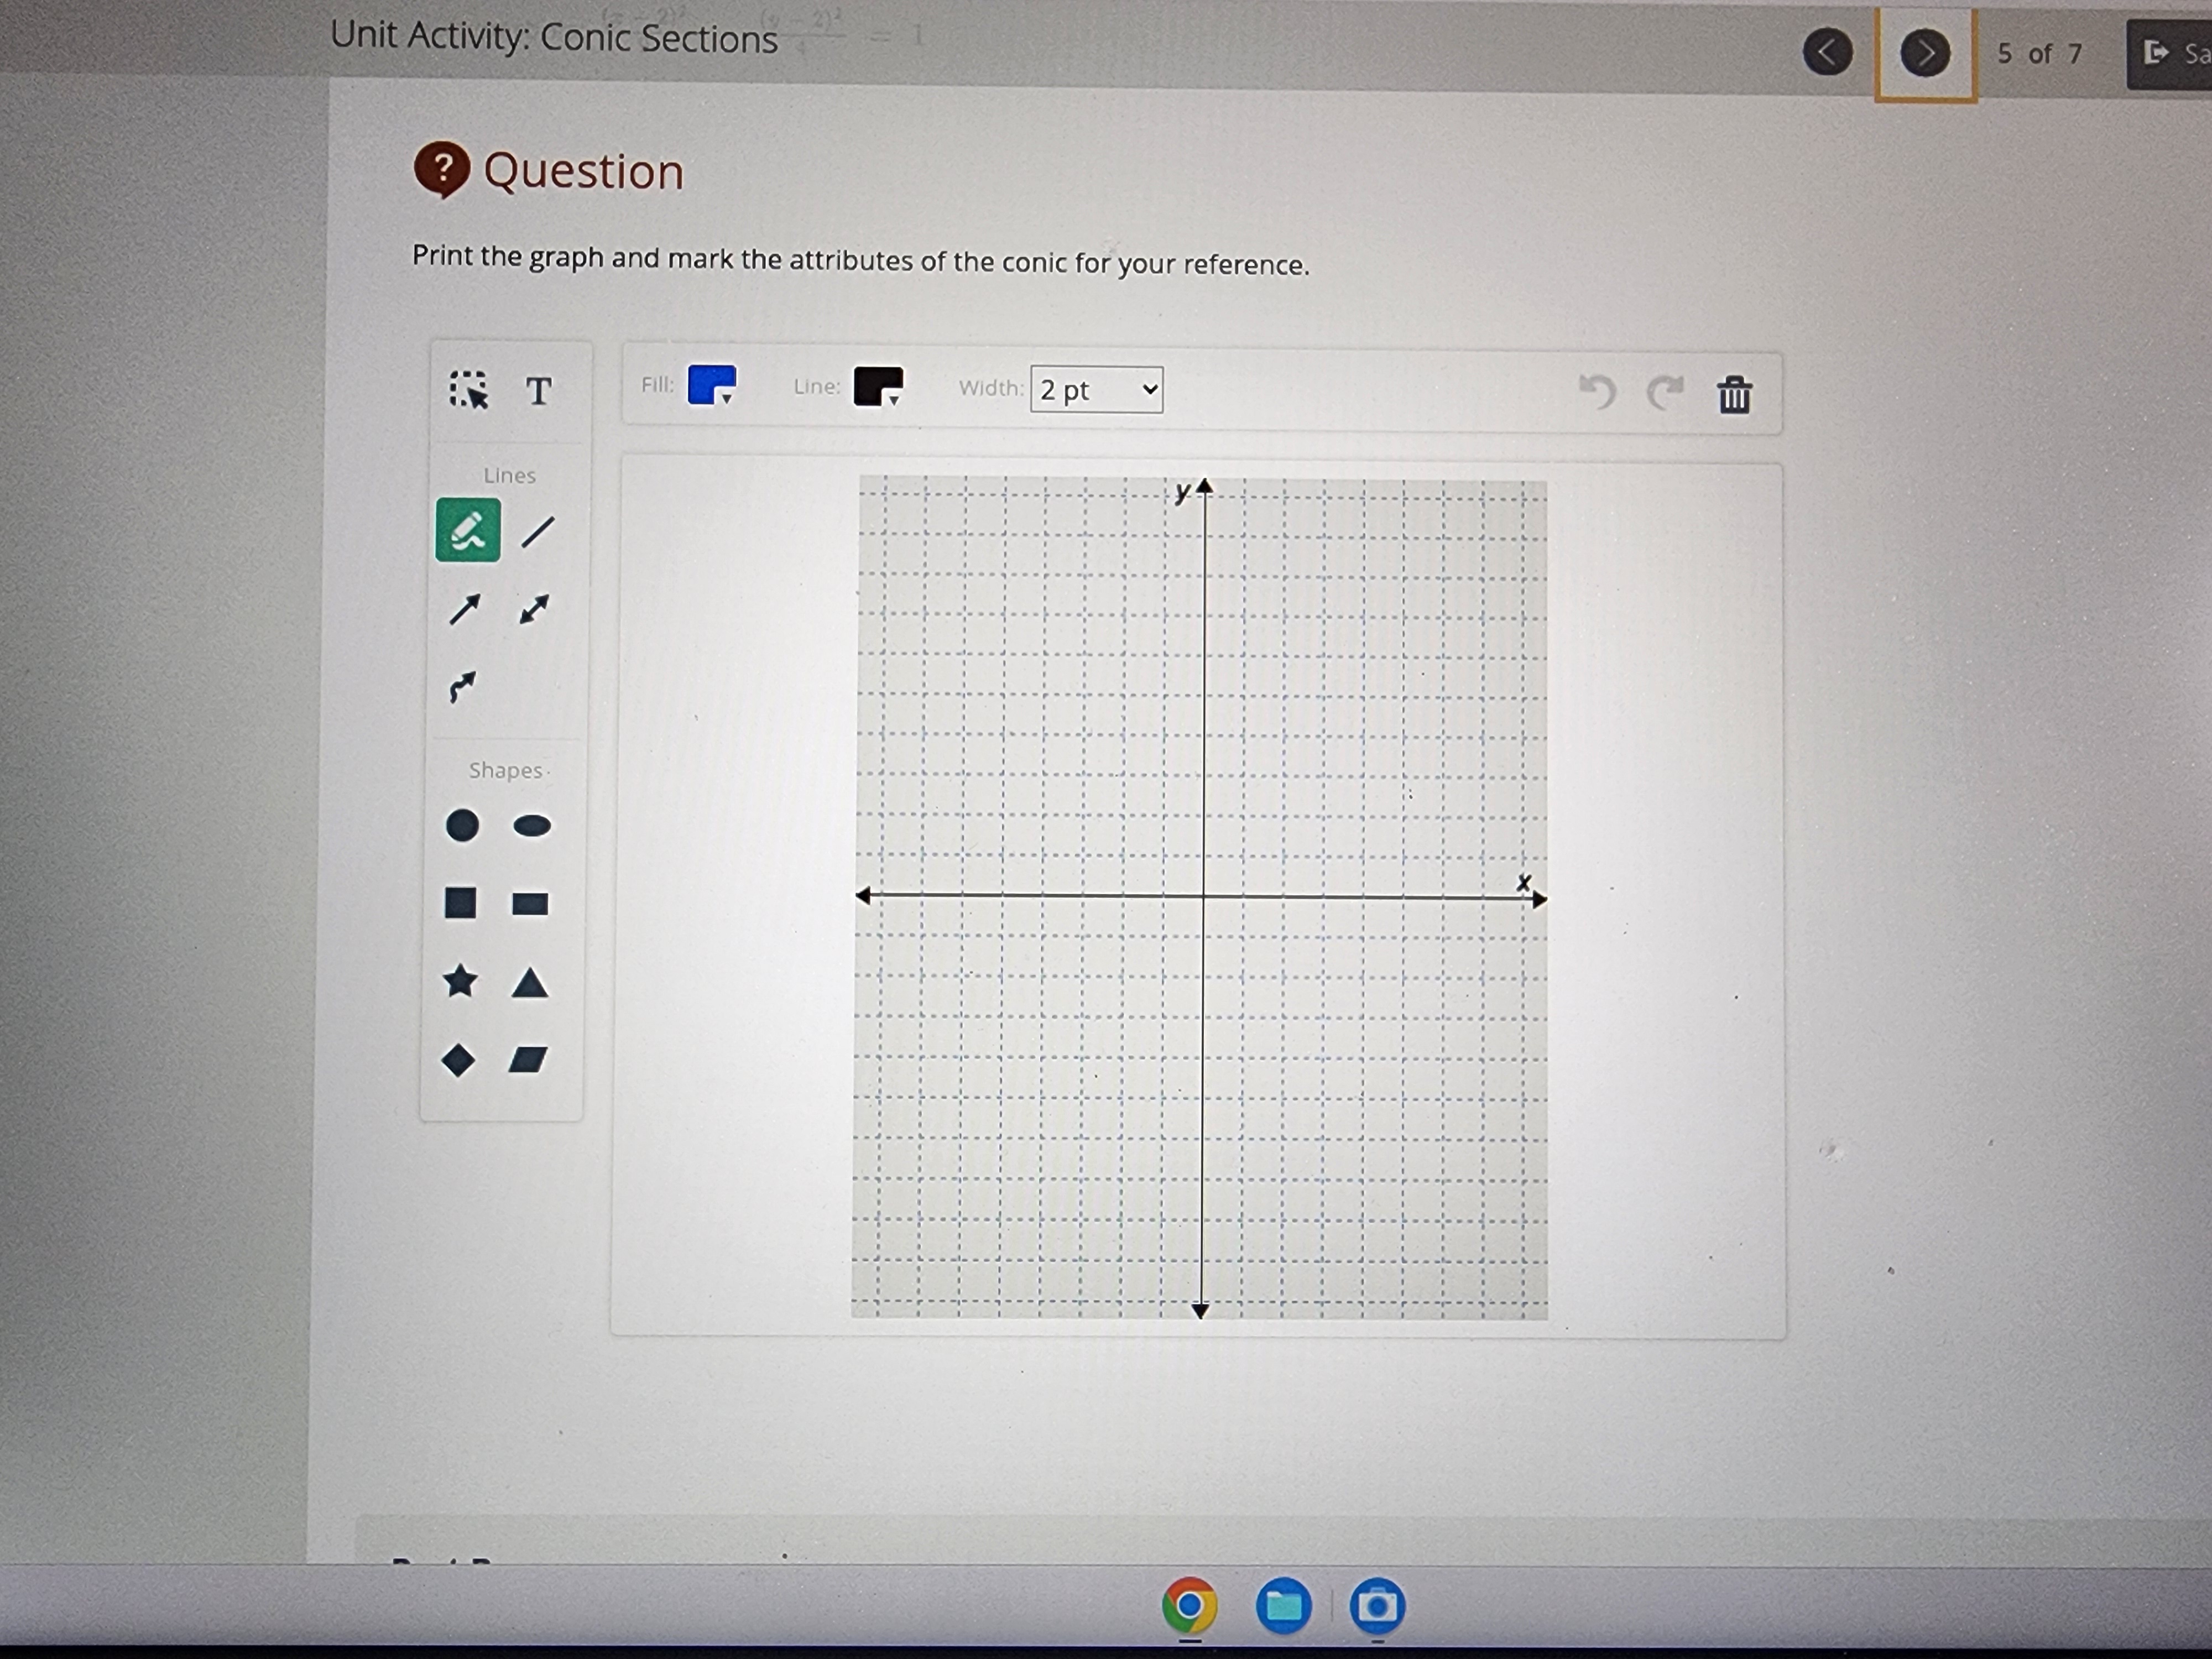
Task 1 Print Computing the Limit of a Difference Quotient In this activity, you will compute the limit of a difference quotient to determine the rate of change of a function at different points along its curve. Part A Consider the function f(x) = x3 - 4x2 + 2. Calculate the limit of the difference quotient at xo = 3 for f(x). BIUXX 15 px Space used (includes formatting): 0 / 30000 Part B Find the equation of a line passing through the same point that f(x) passes through at x = 3 with a slope equal to the limit you found in part A. BIUXX 15px V Space used (includes formatting): 0 / 30000 Part C acervAvaEE;: Part C Graph the function f(x) and the line you identified in part B. How do the graphs r about the function at the given point? Space used (includes formatting): 0 / 30000 ate to each other? What does the slope of the line represent i ihl EH v 8- Unit Activity: Limits: Introduction to Calculus 6 of 8 [ Save & Exit Task 2 Print Finding the Area Under a Curve In this task, you will practice finding the area under a nonlinear function by using rectangles. You will use graphing skills in addition to the knowledge gathered in this unit. Sketch the graph of the function y = 20x - x2, and approximate the area under the curve in the interval [0, 20] by dividing the area into the given numbers of rectangles. Part A Use five rectangles to approximate the area under the curve. BIUXX 15px Space used (includes formatting): 0 / 30000 Part B Use 10 rectangles to approximate the area under the curve. BIUX X2 15px V Space used (includes formatting): 0 / 30000 Part C Jul 12 4:09 acerPart B Use 10 rectangles to approximate the area under the curve. BIUXX 15px V Space used (includes formatting): 0 / 30000 Part C Calculate the area under the curve using rectangles as their number becomes arbitrarily large (tends to infinity). You do not need to sketch the rectangles. BIUXX 15px V Space used (includes formatting): 0 / 30000 acerAs an apprentice working for 1 plus 1 Landscaping, you're learning the tricks of the trade. Your boss wants you to calculate the area between the edge of a garden bed and the side of a house. Using the area, she can calculate the amount of mulch she will need for this job. The edge is defined by the equation y = x + 1. You will use a spreadsheet program to estimate the area under the curve y = x + 1 between x = 0 and x = 10. Let the number of subintervals be n = 5. Follow these steps to calculate the area using right endpoints: 1. Start a blank spreadsheet in Excel, Google Docs, or another spreadsheet program. 2. Define a field in the spreadsheet where you're going to put the values for a, b, n, and delta x (Ax). It's a good practice to label these cells. You can start with something like this: A B 1 a= b= w n = 4 delta X= 3. Refer to the problem description to fill in the values for a, b, and n by placing the numbers in cells B1, B2, and B3, respectively. 4. Create a formula that will calculate Ax in cell B4. 5. Label the cells D1 and E1 x sub / and f(x sub /), respectively: D E x subi f(x subi) 6. Starting at cell D2, fill in the correct values for x, by using the right endpoints. (Note: If you'd like to reference the cell that contains Ax, simply type a dollar sign before the column letter and another dollar sign before the row number, like this: $B$4. This will allow you to copy and paste the formula to other cells, but the formula will always use, for example, cell B4.) 7. Create a formula that will calculate f(x/) in cell E2. (Note: If you'd like to reference the cell that contains Ax, simply type dollar signs before the column letter and the row number, like this: $B$4. This will allow you to copy and paste the formula to other cells, but the formula will always use, for example, cell B4.) 8. Copy the formula to calculate the rest of the values for f(x/). 9. Label cell F1 Area of rectangles. 10 In call [2 renata a formula that will calculate the ama of a cinalastrin or ro Jul 12 O acerYou will use a spreadsheet program to estimate the area under the curve y = x + 1 between x = 0 and x = 10. Let the number of subintervals be n = 5. Follow these steps to calculate the area using right endpoints: 1. Start a blank spreadsheet in Excel, Google Docs, or another spreadsheet program. 2. Define a field in the spreadsheet where you're going to put the values for a, b, n, and delta x (Ax). It's a good practice to label these cells. You can start with something like this: A B 1 a= N b= n= A delta X= 3. Refer to the problem description to fill in the values for a, b, and n by placing the numbers in cells B1, B2, and B3, respectively. 4. Create a formula that will calculate Ax in cell B4. 5. Label the cells D1 and E1 x sub i and f(x sub /), respectively: D E x sub i f(x subi) 6. Starting at cell D2, fill in the correct values for x, by using the right endpoints. (Note: If you'd like to reference the cell that contains Ax, simply type a dollar sign before the column letter and another dollar sign before the row number, like this: $B$4. This will allow you to copy and paste the formula to other cells, but the formula will always use, for example, cell B4.) 7. Create a formula that will calculate f(x/) in cell E2. (Note: If you'd like to reference the cell that contains Ax, simply type dollar signs before the column letter and the row number, like this: $B$4. This will allow you to copy and paste the formula to other cells, but the formula will always use, for example, cell B4.) 8. Copy the formula to calculate the rest of the values for f(x;). 9. Label cell F1 Area of rectangles. 10. In cell F2, create a formula that will calculate the area of a single strip or rectangle. Copy the formula to other cells to find the area of each rectangle. O Jul acerTask 1 H Print Conic Sections Select any conic section (other than a circle). Answer the questions in this task as they relate to the conic section you chose. Question 1 In your own words, define the conic section you chose as a collection of points (loci) on a plane. BIUXX 2 15px V Space used (includes formatting): 0 / 30000 Question 2 Assuming you know the coordinates of the key points (vertex, foci, directrix), explain how to graph the functions of the conic section you chose using your definition of it. BIUXX 2 15px V Space used (includes formatting): 0 / 30000Space used (includes formatting): 0 / 30000 Question 3 Part A Write the standard equation of the conic section you chose with its center or vertex at the origin. Describe the graph. BIUX X 2 15px V VBBY Space used (includes formatting): 0 / 30000 ? Question Part B Use the drawing tool to sketch the graph and label its parts.Unit Activity: Conic Sections 5 of 7 ? Question Part B Use the drawing tool to sketch the graph and label its parts. T Fill: Line: Width: 2 pt v Lines Sy ShapesQuestion 4 Answer the questions in this part of the task based on your understanding of the definition and the standard equation for the conic you chose. Part A Inspect the equation for the type of conic section you chose. What attributes are necessary to graph it? Be sure to include specific points or equations to complete your answer. . parabola: (x - 3)2 = 12(y -2) . ellipse: (2 - 1)2 25 + ( 3 + 1 ) 2 16 = 1 . hyperbola: (z - 2)2 _ (3 -2)2 = 1 acerUnit Activity: Conic Sections 5 of 7 Sa ? Question Print the graph and mark the attributes of the conic for your reference. T Fill: Line: Width: 2 pt v Lines ...&... .. ... .. . . .;...;.. - - 4 . . . 4 . . .. . . i ... - - 1 .. .). - 1 . .. Shapes
Step by Step Solution
There are 3 Steps involved in it

Get step-by-step solutions from verified subject matter experts


