

Answered step by step
Verified Expert Solution
Question
1 Approved Answer
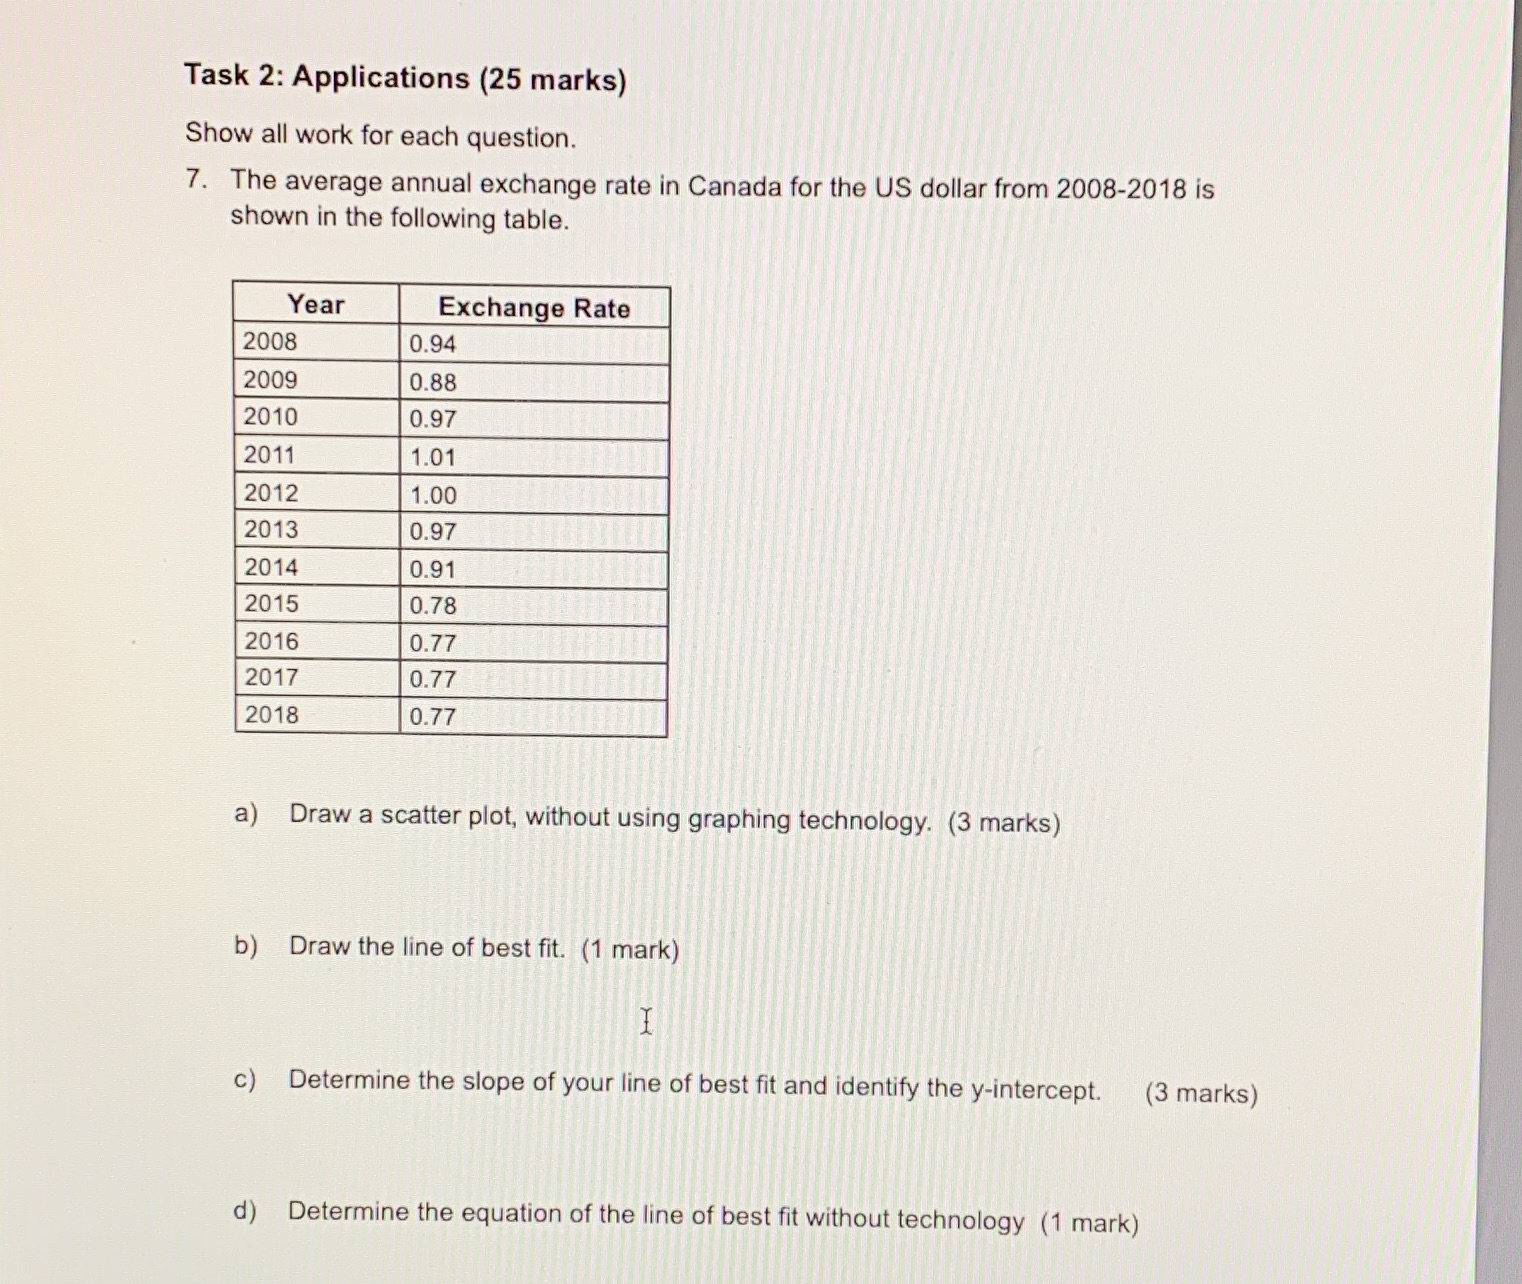
Task 2: Applications (25 marks) Show all work for each question. 7. The average annual exchange rate in Canada for the US dollar from 2008-2018
Step by Step Solution
There are 3 Steps involved in it
Step: 1

Get Instant Access to Expert-Tailored Solutions
See step-by-step solutions with expert insights and AI powered tools for academic success
Step: 2

Step: 3
Ace Your Homework with AI
Get the answers you need in no time with our AI-driven, step-by-step assistance
Get Started
Advanced Engineering Mathematics
Authors: ERWIN KREYSZIG
9th Edition
0471488852, 978-0471488859