

Question
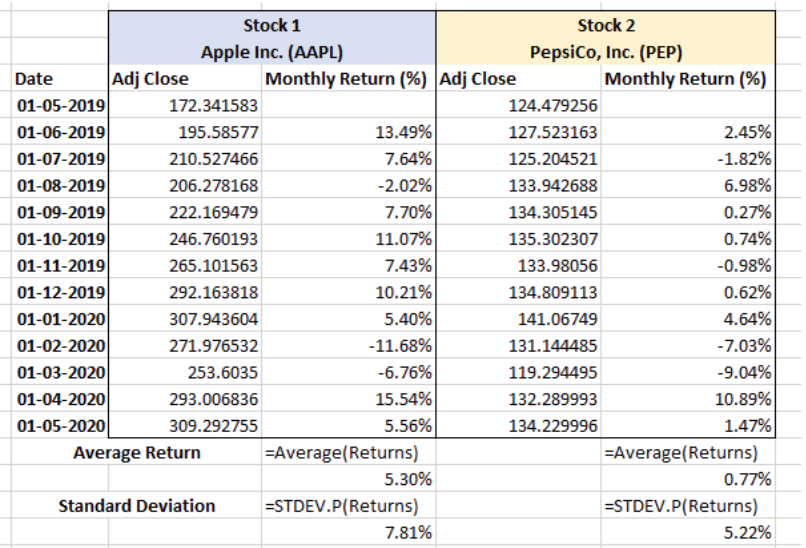
Task 4: Now using a matrix multiplication (i.e. MMULT in Excel.), compute two portfolio returns and portfolio variances. Use the formula: portfolio return: E(R P
Task 4:
Now using a matrix multiplication (i.e. MMULT in Excel.), compute two portfolio returns and portfolio variances.
Use the formula: portfolio return: E(RP) = w * rT
portfolio variance: P2 =wwT
PLEASE SHOW WORK. Thank you!
Step by Step Solution
There are 3 Steps involved in it
Step: 1

Get Instant Access to Expert-Tailored Solutions
See step-by-step solutions with expert insights and AI powered tools for academic success
Step: 2

Step: 3
Ace Your Homework with AI
Get the answers you need in no time with our AI-driven, step-by-step assistance
Get Started
International Finance Discussion Papers The Information Content Of High Frequency Data For Estimating Equity Return Models And Forecasting Risk
Authors: United States Federal Reserve Board, Dobrislav P. Dobrev, Pawel J. Szerszen
1st Edition
1288724810, 9781288724819