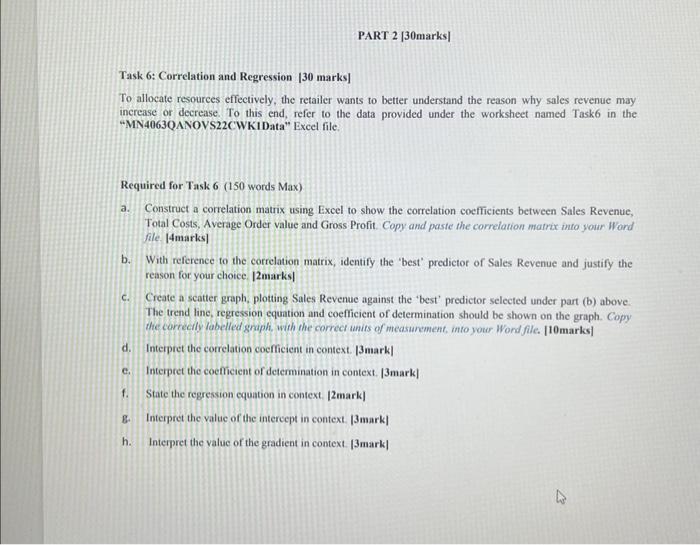
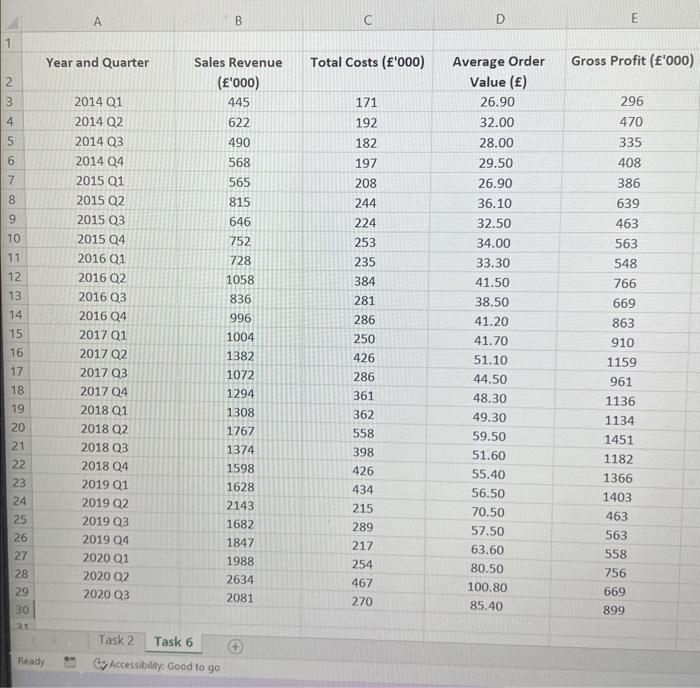
Task 6: Correlation and Regression [30 marks] To allocate resources effectively, the retailer wants to better understand the reason why sales revenue may increase or decrease. To this end, refer to the data provided under the worksheet named Task 6 in the "MN4063QANOVS22CWK1Data" Excel file. Required for Task 6 ( 150 words Max) a. Construct a correlation matrix using Excel to show the correlation coefficients between Sales Revenue, Total Costs. Average Order value and Gross Profit. Copy and paste the correlation matrix mito your Word file. [4marks] b. With reference to the correlation matrix, identify the 'best' predictor of Sales Revenue and justify the reason for your choice. |2marks| c. Create a scatter graph, plotting Sales Revenue against the 'best' predictor selected under part (b) above. The trend line, regression equation and coefficient of determination should be shown on the graph. Copy the correcily labelled gniph, with the correcr units of measunement, into your Wond file. [10marks] d. Inteipret the correlation coefficient in context. |3mark| c. Interpret the coefficient of determination in context. [3mark] f. State the regression equation in context. [2mark] g. Interpret the value of the intercept in context. [3mark] h. Interpret the value of the gradient in context. [3mark] A B C D E Year and Quarter Sales Revenue Total Costs (f000) Average Order Gross Profit (f000) Task 6: Correlation and Regression [30 marks] To allocate resources effectively, the retailer wants to better understand the reason why sales revenue may increase or decrease. To this end, refer to the data provided under the worksheet named Task 6 in the "MN4063QANOVS22CWK1Data" Excel file. Required for Task 6 ( 150 words Max) a. Construct a correlation matrix using Excel to show the correlation coefficients between Sales Revenue, Total Costs. Average Order value and Gross Profit. Copy and paste the correlation matrix mito your Word file. [4marks] b. With reference to the correlation matrix, identify the 'best' predictor of Sales Revenue and justify the reason for your choice. |2marks| c. Create a scatter graph, plotting Sales Revenue against the 'best' predictor selected under part (b) above. The trend line, regression equation and coefficient of determination should be shown on the graph. Copy the correcily labelled gniph, with the correcr units of measunement, into your Wond file. [10marks] d. Inteipret the correlation coefficient in context. |3mark| c. Interpret the coefficient of determination in context. [3mark] f. State the regression equation in context. [2mark] g. Interpret the value of the intercept in context. [3mark] h. Interpret the value of the gradient in context. [3mark] A B C D E Year and Quarter Sales Revenue Total Costs (f000) Average Order Gross Profit (f000)