Task 8
dataset included
task 9 and 10 attached for reference of what is to follow- any advice on how to approach task 9 for SPSS would be appreciated
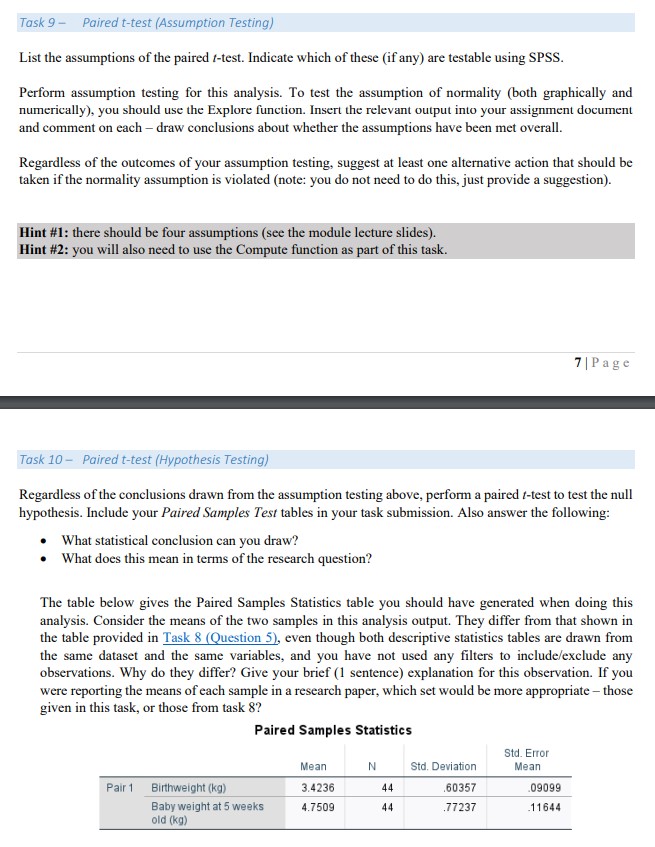
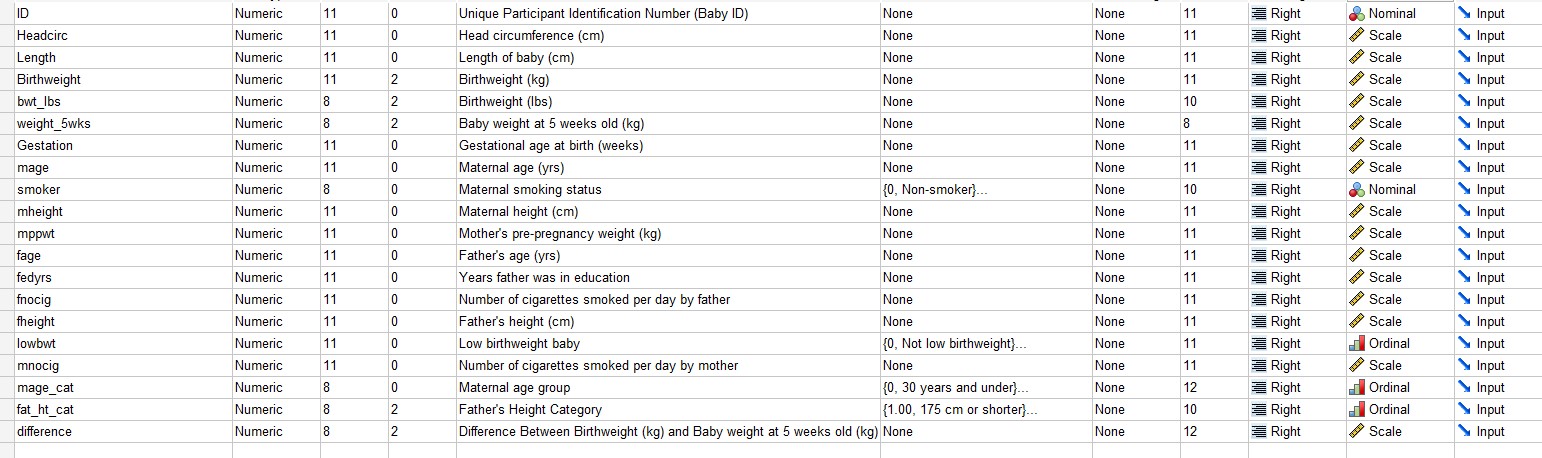
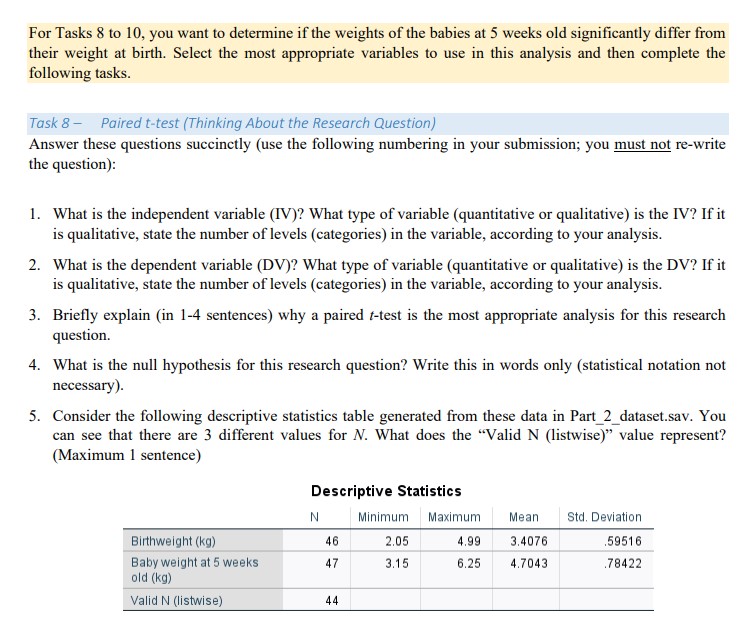
Task 9 - Paired t-test (Assumption Testing) List the assumptions of the paired f-test. Indicate which of these (if any) are testable using SPSS. Perform assumption testing for this analysis. To test the assumption of normality (both graphically and numerically), you should use the Explore function. Insert the relevant output into your assignment document and comment on each - draw conclusions about whether the assumptions have been met overall. Regardless of the outcomes of your assumption testing, suggest at least one alternative action that should be taken if the normality assumption is violated (note: you do not need to do this, just provide a suggestion). Hint #1: there should be four assumptions (see the module lecture slides). Hint #2: you will also need to use the Compute function as part of this task. 7 Page Task 10- Paired t-test (Hypothesis Testing) Regardless of the conclusions drawn from the assumption testing above, perform a paired /-test to test the null hypothesis. Include your Paired Samples Test tables in your task submission. Also answer the following: What statistical conclusion can you draw? What does this mean in terms of the research question? The table below gives the Paired Samples Statistics table you should have generated when doing this analysis. Consider the means of the two samples in this analysis output. They differ from that shown in the table provided in Task 8 (Question 5), even though both descriptive statistics tables are drawn from the same dataset and the same variables, and you have not used any filters to include/exclude any observations. Why do they differ? Give your brief (1 sentence) explanation for this observation. If you were reporting the means of each sample in a research paper, which set would be more appropriate - those given in this task, or those from task 8? Paired Samples Statistics Std. Error Mean N Std. Deviation Mear Pair 1 Birthweight (kg) 3.4236 44 60357 09099 Baby weight at 5 weeks 4.7509 44 .77237 11644 old (kg)Nominal ID Numeric None Input 11 Unique Participant Identification Number (Baby ID) None 11 Right Headcirc Numeric 11 Head circumference (cm) None None 11 Right Scale Input 11 Right Scale `Input Length Numeric 11 10 Length of baby (cm) None None 11 2 Birthweight (kg) None None 11 Right Scale \\Input Birthweight Numeric None 10 Right Scale Input but_Ibs Numeric 8 2 Birthweight (lbs) None Numeric 2 Baby weight at 5 weeks old (kg) None None 8 Right Scale Input weight_5wks 11 Scale Input Gestation Numeric 11 0 Gestational age at birth (weeks) None None Right Numeric 11 Maternal age (yrs) None None 11 Right Scale Input O mage None 10 Numeric 10 Maternal smoking status [0, Non-smoker}... Right Nominal Input smoker 11 Scale Input mheight Numeric 11 0 Maternal height (cm) None None Right Numeric 11 10 Mother's pre-pregnancy weight (kg) None None 11 Right Scale Input mppwt None 11 Right Scale Input fage Numeric 11 Father's age (yrs) None 11 0 Years father was in education None None 11 Right Scale Input fedyrs Numeric Numeric 11 10 Number of cigarettes smoked per day by father None None 11 Right Scale `Input fnocig 11 0 Father's height (cm) None None 11 Numeric Right Scale ` Input fheight 11 Ordinal Input lowbwt Numeric Low birthweight baby Right 11 10 (0, Not low birthweight)... None Input mnocig Numeric 11 Number of cigarettes smoked per day by mother None None 11 Right Scale mage_cat Numeric CO Maternal age group [0, 30 years and under)... None 12 Right Ordinal ` Input NNOO Numeric Father's Height Category [1.00, 175 cm or shorter). None 10 Right Ordinal Input fat_ht_cat Numeric 8 None 12 Right Scale Input difference Difference Between Birthweight (kg) and Baby weight at 5 weeks old (kg) NoneFor Tasks 8 to 10, you want to determine if the weights of the babies at 5 weeks old significantly differ from their weight at birth. Select the most appropriate variables to use in this analysis and then complete the following tasks. Task 8- Paired t-test (Thinking About the Research Question) Answer these questions succinctly (use the following numbering in your submission; you must not re-write the question): 1. What is the independent variable (IV)? What type of variable (quantitative or qualitative) is the IV? If it is qualitative, state the number of levels (categories) in the variable, according to your analysis. 2. What is the dependent variable (DV)? What type of variable (quantitative or qualitative) is the DV? If it is qualitative, state the number of levels (categories) in the variable, according to your analysis. 3. Briefly explain (in 1-4 sentences) why a paired t-test is the most appropriate analysis for this research question. 4. What is the null hypothesis for this research question? Write this in words only (statistical notation not necessary). 5. Consider the following descriptive statistics table generated from these data in Part_2_dataset.sav. You can see that there are 3 different values for N. What does the "Valid N (listwise)" value represent? (Maximum 1 sentence) Descriptive Statistics N Minimum Maximum Mean Std. Deviation Birthweight (kg) 46 2.05 4.99 3.4076 59516 Baby weight at 5 weeks 47 3.15 6.25 4.7043 78422 old (kg) Valid N (listwise) 44