

Answered step by step
Verified Expert Solution
Question
1 Approved Answer
Task: Bilstein has developed a new shock absorber system for racing cars. This new shock has different dampening behavior that is dependent on the amount
Task: Bilstein has developed a new shock absorber system for racing cars. This new shock has different
dampening behavior that is dependent on the amount of compression the shock is seeing. At the crossover point
cp of compression the spring constant changes from a linear behavior to a nonlinear behavior. The
expressions of the spring constants at different compression ranges are shown in the table below:
Shock Behavior
The current parameters for the shock absorber are shown in the table below:
Parameters
Dampening Force is defined as:
As the new engineer and MATLAB expert in the design group, you are tasked with writing a MATLAB code that
will plot the force as a function of compression, so the department head can visualize the dampening behavior. It
is also desired to have a warning displayed if the total travel goes past the maximum compression, which would
bottom out the shock absorber Since the spring constant, crossover point and maximum compression may still
be changed, you need to keep these as variables in your calculations for quick adjustment.
Write a MATLAB script file file that will calculate the dampening force as a function of the compression,
x and generates a plot.
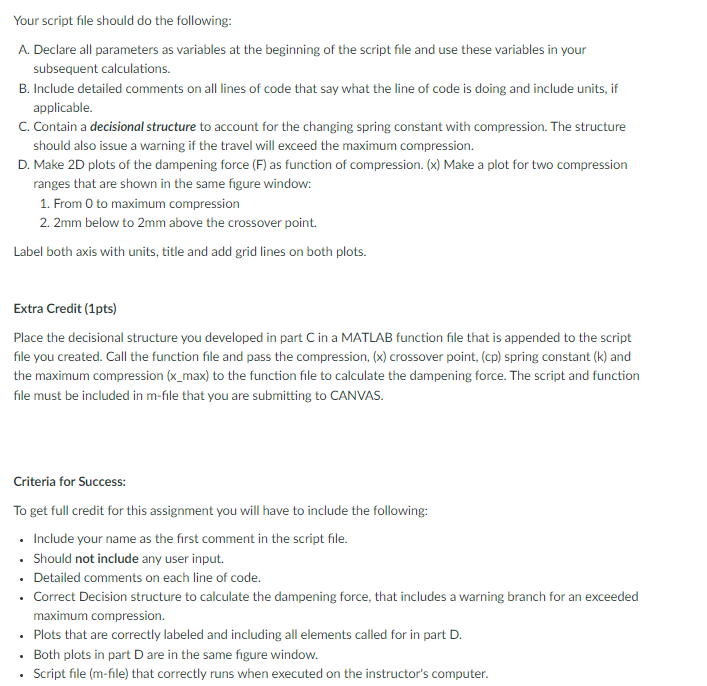
Your script file should do the following:
A Declare all parameters as variables at the beginning of the script file and use these variables in your
subsequent calculations.
B Include detailed comments on all lines of code that say what the line of code is doing and include units, if
applicable.
C Contain a decisional structure to account for the changing spring constant with compression. The structure
should also issue a warning if the travel will exceed the maximum compression.
D Make D plots of the dampening force F as function of compression. x Make a plot for two compression
ranges that are shown in the same figure window:
From to maximum compression
below to above the crossover point.
Label both axis with units, title and add grid lines on both plots.
Extra Credit pts
Place the decisional structure you developed in part C in a MATLAB function file that is appended to the script
file you created. Call the function file and pass the compression, crossover point, spring constant and
the maximum compression max to the function file to calculate the dampening force. The script and function
file must be included in file that you are submitting to CANVAS.
Criteria for Success:
To get full credit for this assignment you will have to include the following:
Include your name as the first comment in the script file.
Should not include any user input.
Detailed comments on each line of code.
Correct Decision structure to calculate the dampening force, that includes a warning branch for an exceeded
maximum compression.
Plots that are correctly labeled and including all elements called for in part D
Both plots in part D are in the same figure window.
Script file mfile that correctly runs when executed on the instructor's computer.
Step by Step Solution
There are 3 Steps involved in it
Step: 1

Get Instant Access to Expert-Tailored Solutions
See step-by-step solutions with expert insights and AI powered tools for academic success
Step: 2

Step: 3
Ace Your Homework with AI
Get the answers you need in no time with our AI-driven, step-by-step assistance
Get Started
Microsoft Word 365 2022 Beginners Guide A Comprehensive User Guide For Beginners And Seniors With Tips And Tricks To Master Word 365
Authors: Howard J Wall
1st Edition
B0B1MGTGQ5, 979-8829667160