Task
Consider the annual report of Adidas for a period of 4 years. Using the different financial ratios, we covered in this course you are required to:
1) critically evaluate the financial statements individually across the 4-year period and cross-sectionally and identify their main strengths and weaknesses, and
2) make recommendations for future improvement.
Note: Students are expected to comment on the change of company financial performance (income statement) and position (balance sheet) during the 4-year period of examination by looking at the main accounts and how they have changed (information may be taken from the notes to the accounts). The aim of this assignment is to familiarize students with the information content of annual reports.
Below, i provide Income statements of Adidas and Financial Highlights where you can find Balance sheet. If you need any other data such as statement of cash flows etc. tell me.
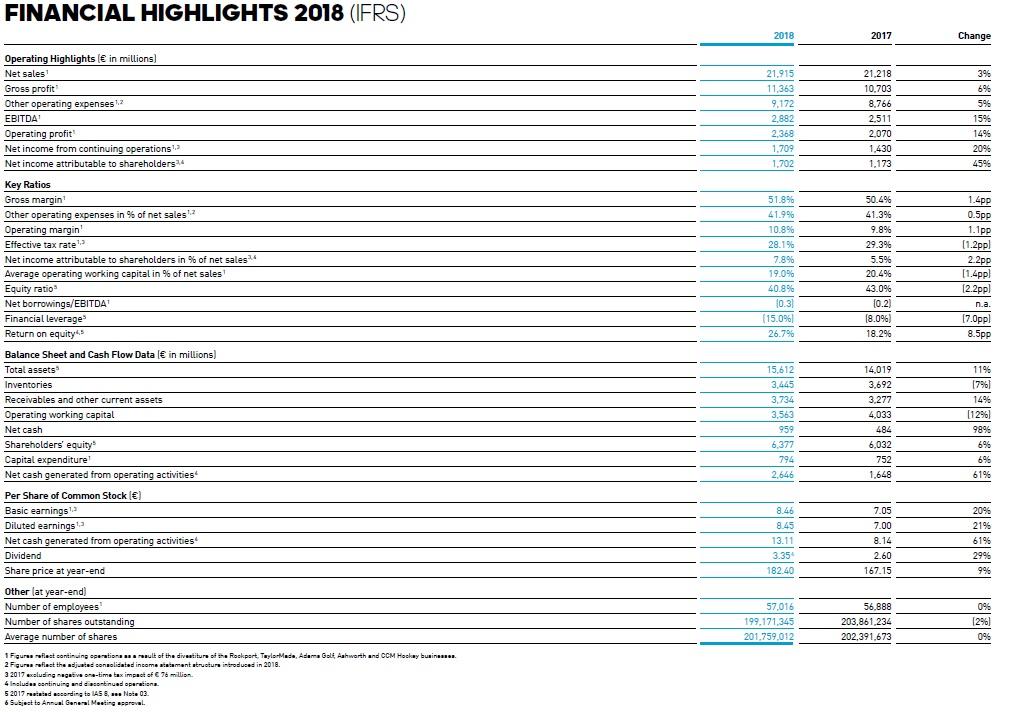
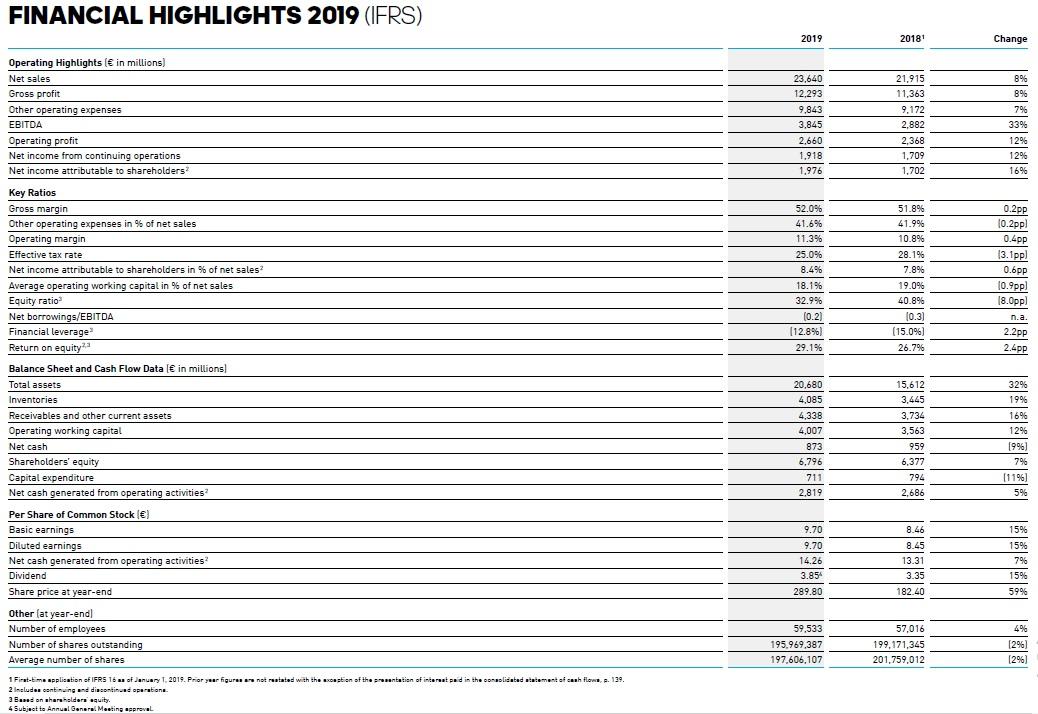
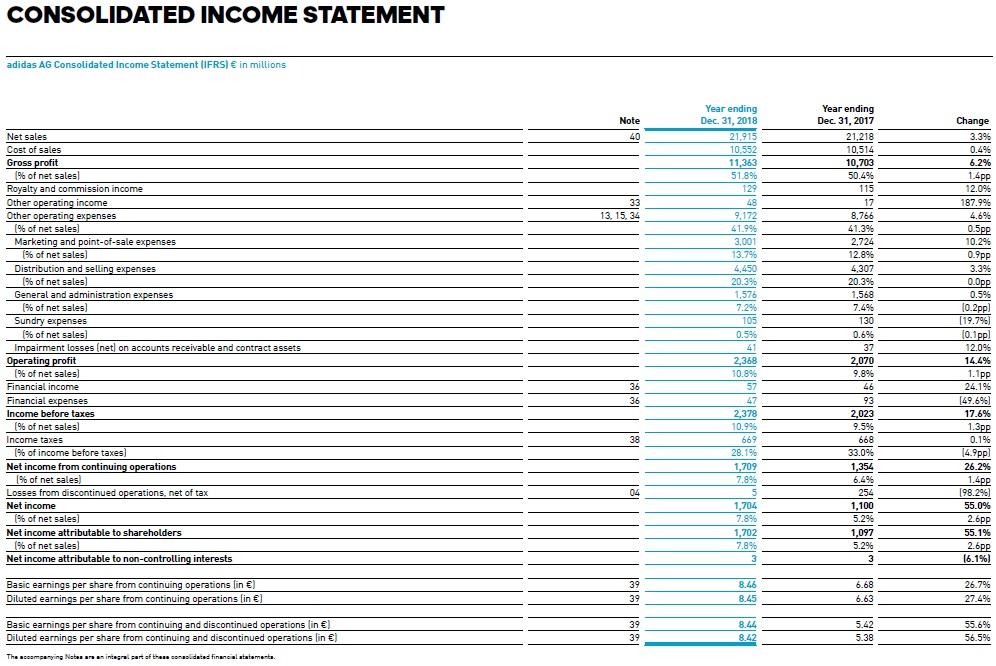
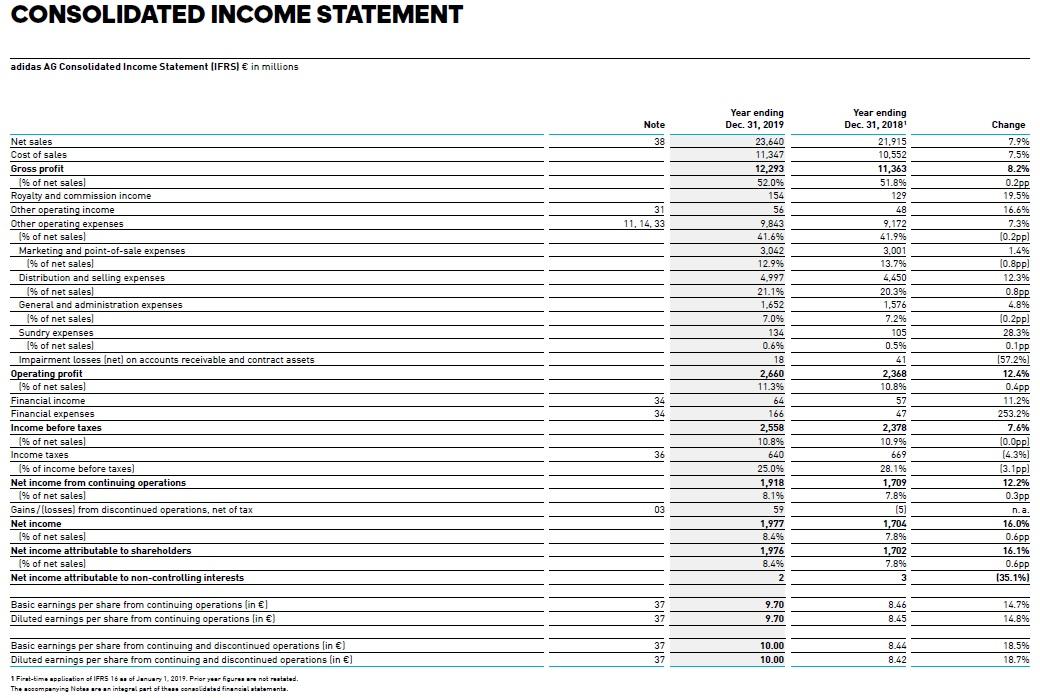
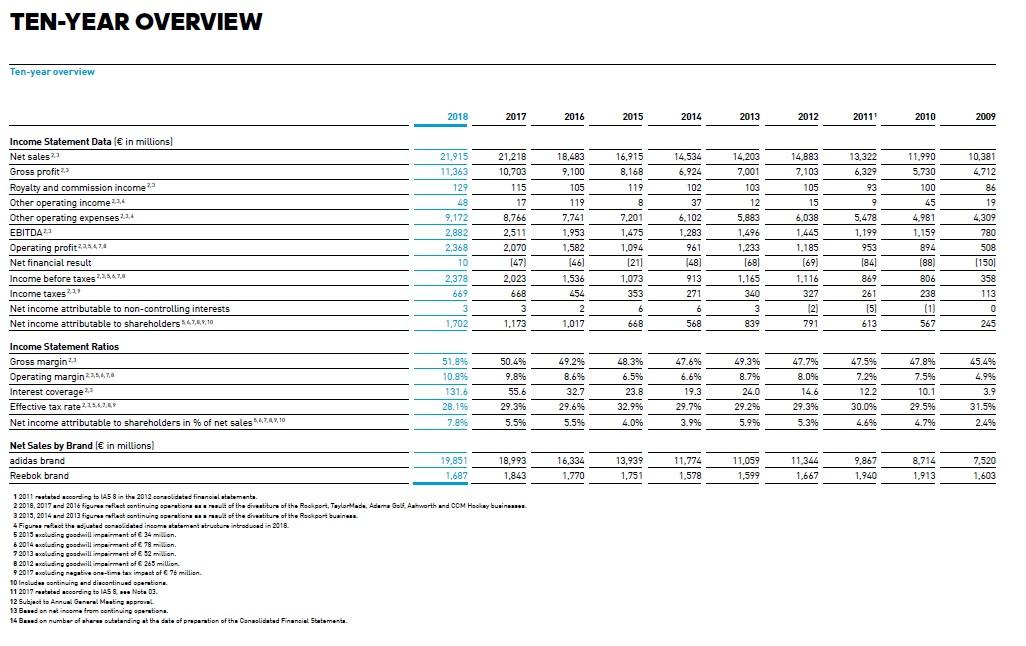
FINANCIAL HIGHLIGHTS 2018 (IFRS) 2018 2017 Change Operating Highlights ( in millions) Net sales Gross profit Other operating expenses EBITDA Operating profit Net income from continuing operations! Net income attributable to shareholders 21.915 11,363 9,172 2.882 2,369 1.709 1,702 21,218 10.703 8.766 2.511 2.070 1.430 1,173 396 6% 5% 159 14% 2096 459. Key Ratios Gross margin Other operating expenses in % of net sales! Operating margin Effective tax rate Net income attributable to shareholders in % of net sales Average operating working capital in % of net sales Equity ratio Net borrowings/EBITDA Financial leverage Return on equity, 51.89 41.9% 10.8% 28.19% 7.8% 19.0% 40.8% 10.31 (15.0% 26.79 50.4% 41.3% 9.8% 29.3% 5.5% 20.4% 43.0% 10.2) 18.0%) 18.296 1.4pp 0.5pp 1.1P (1.2ppl 2.2pp (1.4pp [2.2ppl n.a. 17.0ppl 8.5pp Balance Sheet and Cash Flow Data in millions) Total assets Inventories Receivables and other current assets Operating working capital Net cash Shareholders' equity Capital expenditure Net cash generated from operating activities Per Share of Common Stock le Basic earnings Diluted earnings! Net cash generated from operating activities 15,612 3,445 3,734 3,563 95 6,377 794 2.646 14.019 3,692 3,277 4,033 484 6,032 752 1.648 1196 79 14% % [1296 98% 696 6196 8.46 8.45 13.11 3.35 182.40 7.05 7.00 8.14 2.60 209 21% 61% 2996 996 Dividend Share price at year-end 167.15 Other (at year-end) ( Number of employees Number of shares outstanding Average number of shares 57,016 199,171.345 201.759.012 56,888 203,861.234 202.391,673 096 1290) 09 1 Figures flest continuing sperationsult of the divestiture of the Rockport, TaylorMade Adarna Golt Ashworth and CCM Hackay businesses. 2 Figuruarfiast the adjusted conselicated income tatamant structura introduced in 2018. 3 2017 exclusing negative time tax impact of 76 million 4include continuing and continued operationa. 5 2017 rand escording to IAS, Note 03. 6 Subject to Annual General Meeting serval FINANCIAL HIGHLIGHTS 2019 (IFRS) 2019 2018 Change 8% 896 Operating Highlights ( in millions) Net sales Gross profit Other operating expenses EBITDA Operating profit Net income from continuing operations Net income attributable to shareholders 23,640 12,293 9,843 3,845 2,660 1.918 1.976 21.915 11,363 9,172 2.882 2,368 1.709 1,702 796 33% 12% 12% 16% Key Ratios Gross margin Other operating expenses in % of net sales Operating margin Effective tax rate Net income attributable to shareholders in % of net sales? Average operating working capital in % of net sales Equity ratio Net borrowings/EBITDA Financial leverage Return on equity 52.0% 41.6% 11.3% 25.0% 8.4% 18.1% 32.9% (0.2) (12.8%) 29.1% 51.896 41.9% 10.8% 28.1% 7.8% 19.0% 40.8% 10.3 (15.0%) 26.7% 0.2 pp 10.2pp! 0.4pp 13.1ppl 0.6pp 10.9pp) 18.Oppl n.a. 2.2 pp 2.4pp Balance Sheet and Cash Flow Data ( in millions Total assets Inventories Receivables and other current assets Operating working capital Net cash Shareholders' equity Capital expenditure Net cash generated from operating activities 20,680 4,085 4,338 4,007 873 6,796 711 2.819 15,612 3,445 3,734 3,563 959 6,377 794 2,686 32% 19 1996 16% 12% 19%) 7% [11%) 5% 8.46 15% Per Share of Common Stock ) Basic earnings Diluted earnings Net cash generated from operating activities Dividend Share price at year-end Other lat year-end Number of employees Number of shares outstanding Average number of shares 9.70 9.70 14.26 3.85 289.80 8.45 13.31 3.35 182.40 15% 7% 15% 59% 59,533 195,969,387 197,606,107 57,016 199,171,345 201,759,012 (29) [ 1296 1 First-time application of IFRS 16 of January 1, 2015. Prior year figures not reastated with the constien of the rentation of interest paid in the consolidated statement of cash flow, s. 139. 2 Includes continuing and discontinand operations 3 End on shareholders equity 4 Subject to Annual General Meeting approval CONSOLIDATED INCOME STATEMENT adidas AG Consolidated Income Statement (IFRS) in millions Note 40 33 13, 15, 34 Net sales Cost of sales Gross profit 1% of net sales Royalty and commission income Other operating income Other operating expenses (% of net sales) Marketing and point-of-sale expenses (% of net sales Distribution and selling expenses % of net sales) General and administration expenses % of net sales) Sundry expenses (% of net sales) Impairment losses (net) on accounts receivable and contract assets Operating profit (% of net sales] Financial income Financial expenses Income before taxes (% of net sales) Income taxes 1% of income before taxes) Net income from continuing operations 19% of net sales) Losses from discontinued operations, net of tax Net income (% of net sales Net income attributable to shareholders (% of net sales] Net income attributable to non-controlling interests Year ending Dec 31, 2018 21,915 10,552 11,363 51.89 129 48 9.172 41.996 3,001 13.79 4,450 20.3% 1,576 7.29% 105 0.5% 41 2,368 10.8% 57 47 2,378 10.99 669 28.19 1,709 7.8% Year ending Dec 31, 2017 21.218 10,514 10,703 50.49 115 17 8.766 41.39 2.724 12.89 4,307 20.3% 1,568 7.4% 130 0.6% 37 2,070 9.896 46 93 2,023 9.5% 668 33.0% 1,354 6.4% % 254 1,100 5.296 1,097 5.2% 3 Change 3.3% 0.4% 6.2% 1.4pp 12.0% 187.9% 4.6% 0.5pp 10.29 0.9 pp 3.396 0.0pp 0.596 (0.2ppl (19.79% (0 sp) 12.096 14.4% 1.1 pp 24.19 [49.6%) 17.6% 1.3pp 0.196 14.9 pp] 26.2% 1.4pp 198.296) 55.0% 2.6pp 55.1% 2.bpp 16.1%) 36 36 38 04 1,704 7.8% 1,702 7.89 Basic earnings per share from continuing operations lin ) Diluted earnings per share from continuing operations in ) 39 39 8.46 8.45 6.68 6.63 26.7% 27.4% Basic earnings per share from continuing and discontinued operations lin ) Diluted earnings per share from continuing and discontinued operations in ) The companying Neben an integral part of transcended financial statements 39 39 8.44 8.42 5.42 5.38 55.6% 56.5% CONSOLIDATED INCOME STATEMENT adidas AG Consolidated Income Statement (IFRS) in millions Note 38 31 11, 14, 33 Net sales Cost of sales Gross profit % of net sales Royalty and commission income Other operating income Other operating expenses 1% of net sales! Marketing and point-of-sale expenses 1% of net sales Distribution and selling expenses 196 of net sales General and administration expenses % of net sales Sundry expenses 1% of net sales Impairment losses (net) on accounts receivable and contract assets Operating profit % of net sales) Financial income Financial expenses Income before taxes 1% of net sales) Income taxes 1% of income before taxes) Net income from continuing operations 196 of net sales) Gains/flosses) from discontinued operations, net of tax Net income % of net sales Net income attributable to shareholders % of net sales Net income attributable to non-controlling interests Year ending Dec 31, 2019 23,640 11,347 12,293 52.0% 154 56 9.843 41.6% 3,042 12.9% 4.997 21.1% 1.652 7.0% 134 0.6% 18 2,660 11.39 64 166 2,558 10.896 640 25.0% 1,918 8.1% 59 1,977 8.49 1,976 8.496 2 Year ending Dec. 31, 2018 21,915 10,552 11,363 51.8% 129 48 9,172 41.9% 3,001 13.7% 4,450 20.3% 1.576 7.296 105 0.5% 41 2,368 10.8% 57 47 2,378 10.996 669 28.1% 1.709 7.8% (5) 5 1,704 7.8% 1,702 7.8% 3 Change 7.9% 7.5% 8.2% 0.2 pp 19.5% 16.6% 7.3% 10.2pp) 1.4% (0.8pp! 12.3% 0.8 pp 4.8% (0.2pp! 28.3% 0.1 pp (57.2%) 12.4% 0.4pp 11.2% 253.2% 7.6% 10.Opp) (4.3%) (3.1 pp] 12.2% 0.3pp n.a. 16.0% 0.6pp 16.1% 0.6 pp (35.1%) 34 34 36 03 Basic earnings per share from continuing operations in Diluted earnings per share from continuing operations lin ) 37 37 9.70 9.70 8.46 8.45 14.7% 14.8% 37 37 10.00 10.00 8.44 8.42 18.5% 18.7% Basic earnings per share from continuing and discontinued operations (in ) Diluted earnings per share from continuing and discontinued operations (in ) 1 First-time application of IFRS 16 of January 1, 2019. Prior year figures not related The companying Notes are an integral part of the naslidated financial statementa. TEN-YEAR OVERVIEW Ten-year overview 2018 2017 2016 2015 2014 2013 2012 2011 2010 2009 10,381 16,915 8,168 14,883 7,103 4,712 Income Statement Data ( in millions Net sales 23 Gross profit Royalty and commission income? Other operating income 2,4 Other operating expenses 224 EBITDA Operating profit224.414 Net financial result Income before taxes 2.24420 Income taxes Net income attributable to non-controlling interests Net income attributable to shareholders 147,66,10 21,915 11,363 129 48 9,172 2,882 2.368 10 2,378 669 21,218 10,703 115 17 8,766 2,511 2,070 [47] 2,023 668 3 1.173 18,483 9,100 105 119 7.741 1.953 1,582 146 1.536 454 119 8 7,201 1,475 1,094 (21) 1,073 353 14.534 6,924 102 37 6.102 1.283 961 148) 14,203 7,001 103 12 5,883 1,496 1.233 (68) 1,165 340 3 839 105 15 6,038 1.445 1.185 (69) 1.116 327 (12) 791 13.322 6,329 93 9 5.478 1,199 953 1841 869 261 15 613 11,990 5.730 100 45 4.981 1.159 894 (88) 806 238 (1 567 86 19 4,309 780 508 (150) 358 113 O 0 245 913 271 6 568 6 2 1,017 1,702 668 Income Statement Ratios Gross margin- Operating margin224470 Interest coverage Effective tax rate22942 Net income attributable to shareholders in % of net sales 4.748,10 51.89 10.89 131.6 28.1% 7.896 50.4% 9.8% 55.6 29.3% 5.5% 49.2% 8.6% 32.7 29.696 5.59 48.3% 6.5% 23.8 32.9% 4.09 47.6% 6.6% 19.3 29.7% 3.99 49.3% 8.79% 24.0 29.2% 5.99 47.7% 8.0% 14.6 29.3% 5.39 47.596 7.2% 12.2 30.0% 4.6% 47.8% 7.5% 10.1 29.5% 4.79 45.4% 4.996 3.9 31.5% 2.4% 16,334 1,770 13,939 1,751 11.774 1,578 11.059 1,599 11,344 1,667 9.867 1,940 8.714 1,913 7.520 1,603 Net Sales by Brand ( in millions) adidas brand 19,851 18,993 Reebok brand 1,687 1,843 1 2011 restabes card to IAS in the 2012 corabideed financial statemente 2 2018 2017 and 2016 figures reflect continuing operationer of the creatiture of the Rockport, Taylarlade, Adama Gol Ashworth and COM Hackay business 3 2015, 2014 and 2013 figureflect continuing sperationer of the chestiture of the Rockport business 4 Figure at the susted solidated income statement structure introduced in 2018 5 2015 excluding gosdrill impairment of 34 million 6 2014 excluding goodrill impairment of 78... 72013 excluding goodwill impairment of 52 B2012 excluding goodwill impairment of E265 million 9 2017 excluding negative sne-time tax impact of 76 million 10 Includes continuing and discontinued operations. 11 2017 stated according to IAS 8. Nate 03 12 Subject to anual General Meating approval 13 Bured on nationalromatining operations. 14 Bus on number of her standing at the date of preparation of the Cenaslidated Financial Statements FINANCIAL HIGHLIGHTS 2018 (IFRS) 2018 2017 Change Operating Highlights ( in millions) Net sales Gross profit Other operating expenses EBITDA Operating profit Net income from continuing operations! Net income attributable to shareholders 21.915 11,363 9,172 2.882 2,369 1.709 1,702 21,218 10.703 8.766 2.511 2.070 1.430 1,173 396 6% 5% 159 14% 2096 459. Key Ratios Gross margin Other operating expenses in % of net sales! Operating margin Effective tax rate Net income attributable to shareholders in % of net sales Average operating working capital in % of net sales Equity ratio Net borrowings/EBITDA Financial leverage Return on equity, 51.89 41.9% 10.8% 28.19% 7.8% 19.0% 40.8% 10.31 (15.0% 26.79 50.4% 41.3% 9.8% 29.3% 5.5% 20.4% 43.0% 10.2) 18.0%) 18.296 1.4pp 0.5pp 1.1P (1.2ppl 2.2pp (1.4pp [2.2ppl n.a. 17.0ppl 8.5pp Balance Sheet and Cash Flow Data in millions) Total assets Inventories Receivables and other current assets Operating working capital Net cash Shareholders' equity Capital expenditure Net cash generated from operating activities Per Share of Common Stock le Basic earnings Diluted earnings! Net cash generated from operating activities 15,612 3,445 3,734 3,563 95 6,377 794 2.646 14.019 3,692 3,277 4,033 484 6,032 752 1.648 1196 79 14% % [1296 98% 696 6196 8.46 8.45 13.11 3.35 182.40 7.05 7.00 8.14 2.60 209 21% 61% 2996 996 Dividend Share price at year-end 167.15 Other (at year-end) ( Number of employees Number of shares outstanding Average number of shares 57,016 199,171.345 201.759.012 56,888 203,861.234 202.391,673 096 1290) 09 1 Figures flest continuing sperationsult of the divestiture of the Rockport, TaylorMade Adarna Golt Ashworth and CCM Hackay businesses. 2 Figuruarfiast the adjusted conselicated income tatamant structura introduced in 2018. 3 2017 exclusing negative time tax impact of 76 million 4include continuing and continued operationa. 5 2017 rand escording to IAS, Note 03. 6 Subject to Annual General Meeting serval FINANCIAL HIGHLIGHTS 2019 (IFRS) 2019 2018 Change 8% 896 Operating Highlights ( in millions) Net sales Gross profit Other operating expenses EBITDA Operating profit Net income from continuing operations Net income attributable to shareholders 23,640 12,293 9,843 3,845 2,660 1.918 1.976 21.915 11,363 9,172 2.882 2,368 1.709 1,702 796 33% 12% 12% 16% Key Ratios Gross margin Other operating expenses in % of net sales Operating margin Effective tax rate Net income attributable to shareholders in % of net sales? Average operating working capital in % of net sales Equity ratio Net borrowings/EBITDA Financial leverage Return on equity 52.0% 41.6% 11.3% 25.0% 8.4% 18.1% 32.9% (0.2) (12.8%) 29.1% 51.896 41.9% 10.8% 28.1% 7.8% 19.0% 40.8% 10.3 (15.0%) 26.7% 0.2 pp 10.2pp! 0.4pp 13.1ppl 0.6pp 10.9pp) 18.Oppl n.a. 2.2 pp 2.4pp Balance Sheet and Cash Flow Data ( in millions Total assets Inventories Receivables and other current assets Operating working capital Net cash Shareholders' equity Capital expenditure Net cash generated from operating activities 20,680 4,085 4,338 4,007 873 6,796 711 2.819 15,612 3,445 3,734 3,563 959 6,377 794 2,686 32% 19 1996 16% 12% 19%) 7% [11%) 5% 8.46 15% Per Share of Common Stock ) Basic earnings Diluted earnings Net cash generated from operating activities Dividend Share price at year-end Other lat year-end Number of employees Number of shares outstanding Average number of shares 9.70 9.70 14.26 3.85 289.80 8.45 13.31 3.35 182.40 15% 7% 15% 59% 59,533 195,969,387 197,606,107 57,016 199,171,345 201,759,012 (29) [ 1296 1 First-time application of IFRS 16 of January 1, 2015. Prior year figures not reastated with the constien of the rentation of interest paid in the consolidated statement of cash flow, s. 139. 2 Includes continuing and discontinand operations 3 End on shareholders equity 4 Subject to Annual General Meeting approval CONSOLIDATED INCOME STATEMENT adidas AG Consolidated Income Statement (IFRS) in millions Note 40 33 13, 15, 34 Net sales Cost of sales Gross profit 1% of net sales Royalty and commission income Other operating income Other operating expenses (% of net sales) Marketing and point-of-sale expenses (% of net sales Distribution and selling expenses % of net sales) General and administration expenses % of net sales) Sundry expenses (% of net sales) Impairment losses (net) on accounts receivable and contract assets Operating profit (% of net sales] Financial income Financial expenses Income before taxes (% of net sales) Income taxes 1% of income before taxes) Net income from continuing operations 19% of net sales) Losses from discontinued operations, net of tax Net income (% of net sales Net income attributable to shareholders (% of net sales] Net income attributable to non-controlling interests Year ending Dec 31, 2018 21,915 10,552 11,363 51.89 129 48 9.172 41.996 3,001 13.79 4,450 20.3% 1,576 7.29% 105 0.5% 41 2,368 10.8% 57 47 2,378 10.99 669 28.19 1,709 7.8% Year ending Dec 31, 2017 21.218 10,514 10,703 50.49 115 17 8.766 41.39 2.724 12.89 4,307 20.3% 1,568 7.4% 130 0.6% 37 2,070 9.896 46 93 2,023 9.5% 668 33.0% 1,354 6.4% % 254 1,100 5.296 1,097 5.2% 3 Change 3.3% 0.4% 6.2% 1.4pp 12.0% 187.9% 4.6% 0.5pp 10.29 0.9 pp 3.396 0.0pp 0.596 (0.2ppl (19.79% (0 sp) 12.096 14.4% 1.1 pp 24.19 [49.6%) 17.6% 1.3pp 0.196 14.9 pp] 26.2% 1.4pp 198.296) 55.0% 2.6pp 55.1% 2.bpp 16.1%) 36 36 38 04 1,704 7.8% 1,702 7.89 Basic earnings per share from continuing operations lin ) Diluted earnings per share from continuing operations in ) 39 39 8.46 8.45 6.68 6.63 26.7% 27.4% Basic earnings per share from continuing and discontinued operations lin ) Diluted earnings per share from continuing and discontinued operations in ) The companying Neben an integral part of transcended financial statements 39 39 8.44 8.42 5.42 5.38 55.6% 56.5% CONSOLIDATED INCOME STATEMENT adidas AG Consolidated Income Statement (IFRS) in millions Note 38 31 11, 14, 33 Net sales Cost of sales Gross profit % of net sales Royalty and commission income Other operating income Other operating expenses 1% of net sales! Marketing and point-of-sale expenses 1% of net sales Distribution and selling expenses 196 of net sales General and administration expenses % of net sales Sundry expenses 1% of net sales Impairment losses (net) on accounts receivable and contract assets Operating profit % of net sales) Financial income Financial expenses Income before taxes 1% of net sales) Income taxes 1% of income before taxes) Net income from continuing operations 196 of net sales) Gains/flosses) from discontinued operations, net of tax Net income % of net sales Net income attributable to shareholders % of net sales Net income attributable to non-controlling interests Year ending Dec 31, 2019 23,640 11,347 12,293 52.0% 154 56 9.843 41.6% 3,042 12.9% 4.997 21.1% 1.652 7.0% 134 0.6% 18 2,660 11.39 64 166 2,558 10.896 640 25.0% 1,918 8.1% 59 1,977 8.49 1,976 8.496 2 Year ending Dec. 31, 2018 21,915 10,552 11,363 51.8% 129 48 9,172 41.9% 3,001 13.7% 4,450 20.3% 1.576 7.296 105 0.5% 41 2,368 10.8% 57 47 2,378 10.996 669 28.1% 1.709 7.8% (5) 5 1,704 7.8% 1,702 7.8% 3 Change 7.9% 7.5% 8.2% 0.2 pp 19.5% 16.6% 7.3% 10.2pp) 1.4% (0.8pp! 12.3% 0.8 pp 4.8% (0.2pp! 28.3% 0.1 pp (57.2%) 12.4% 0.4pp 11.2% 253.2% 7.6% 10.Opp) (4.3%) (3.1 pp] 12.2% 0.3pp n.a. 16.0% 0.6pp 16.1% 0.6 pp (35.1%) 34 34 36 03 Basic earnings per share from continuing operations in Diluted earnings per share from continuing operations lin ) 37 37 9.70 9.70 8.46 8.45 14.7% 14.8% 37 37 10.00 10.00 8.44 8.42 18.5% 18.7% Basic earnings per share from continuing and discontinued operations (in ) Diluted earnings per share from continuing and discontinued operations (in ) 1 First-time application of IFRS 16 of January 1, 2019. Prior year figures not related The companying Notes are an integral part of the naslidated financial statementa. TEN-YEAR OVERVIEW Ten-year overview 2018 2017 2016 2015 2014 2013 2012 2011 2010 2009 10,381 16,915 8,168 14,883 7,103 4,712 Income Statement Data ( in millions Net sales 23 Gross profit Royalty and commission income? Other operating income 2,4 Other operating expenses 224 EBITDA Operating profit224.414 Net financial result Income before taxes 2.24420 Income taxes Net income attributable to non-controlling interests Net income attributable to shareholders 147,66,10 21,915 11,363 129 48 9,172 2,882 2.368 10 2,378 669 21,218 10,703 115 17 8,766 2,511 2,070 [47] 2,023 668 3 1.173 18,483 9,100 105 119 7.741 1.953 1,582 146 1.536 454 119 8 7,201 1,475 1,094 (21) 1,073 353 14.534 6,924 102 37 6.102 1.283 961 148) 14,203 7,001 103 12 5,883 1,496 1.233 (68) 1,165 340 3 839 105 15 6,038 1.445 1.185 (69) 1.116 327 (12) 791 13.322 6,329 93 9 5.478 1,199 953 1841 869 261 15 613 11,990 5.730 100 45 4.981 1.159 894 (88) 806 238 (1 567 86 19 4,309 780 508 (150) 358 113 O 0 245 913 271 6 568 6 2 1,017 1,702 668 Income Statement Ratios Gross margin- Operating margin224470 Interest coverage Effective tax rate22942 Net income attributable to shareholders in % of net sales 4.748,10 51.89 10.89 131.6 28.1% 7.896 50.4% 9.8% 55.6 29.3% 5.5% 49.2% 8.6% 32.7 29.696 5.59 48.3% 6.5% 23.8 32.9% 4.09 47.6% 6.6% 19.3 29.7% 3.99 49.3% 8.79% 24.0 29.2% 5.99 47.7% 8.0% 14.6 29.3% 5.39 47.596 7.2% 12.2 30.0% 4.6% 47.8% 7.5% 10.1 29.5% 4.79 45.4% 4.996 3.9 31.5% 2.4% 16,334 1,770 13,939 1,751 11.774 1,578 11.059 1,599 11,344 1,667 9.867 1,940 8.714 1,913 7.520 1,603 Net Sales by Brand ( in millions) adidas brand 19,851 18,993 Reebok brand 1,687 1,843 1 2011 restabes card to IAS in the 2012 corabideed financial statemente 2 2018 2017 and 2016 figures reflect continuing operationer of the creatiture of the Rockport, Taylarlade, Adama Gol Ashworth and COM Hackay business 3 2015, 2014 and 2013 figureflect continuing sperationer of the chestiture of the Rockport business 4 Figure at the susted solidated income statement structure introduced in 2018 5 2015 excluding gosdrill impairment of 34 million 6 2014 excluding goodrill impairment of 78... 72013 excluding goodwill impairment of 52 B2012 excluding goodwill impairment of E265 million 9 2017 excluding negative sne-time tax impact of 76 million 10 Includes continuing and discontinued operations. 11 2017 stated according to IAS 8. Nate 03 12 Subject to anual General Meating approval 13 Bured on nationalromatining operations. 14 Bus on number of her standing at the date of preparation of the Cenaslidated Financial Statements


