

Question
Task: From the perspective of the new Finance Manager of FA to respond to the Board of Directors request to present a big picture brief
Task:
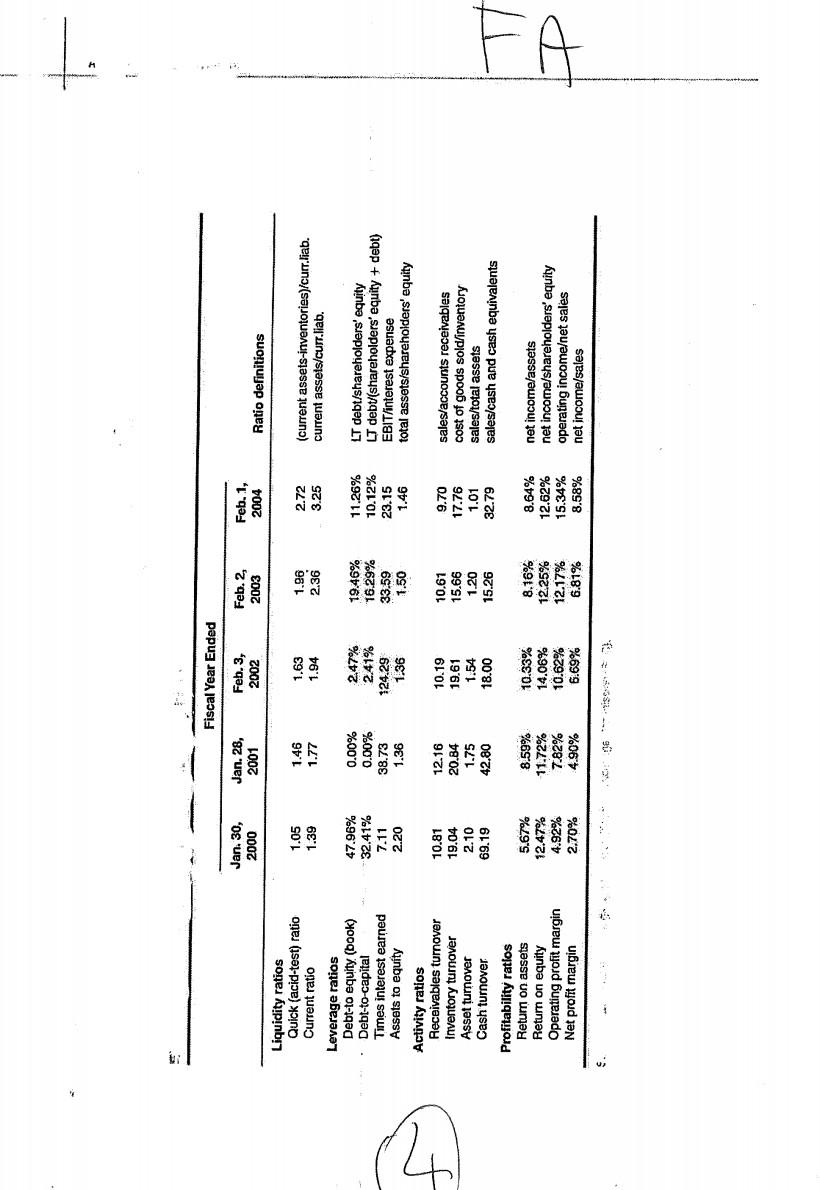
From the perspective of the new Finance Manager of FA to respond to the Board of Directors request to present a big picture brief report on FAs financial performance from 2000 to 2004. In particulars, the Board of Directors like to hear from you whether FA is able to generate value as measured by ROE going forward; in particular, whether there are any concerns about FAs financial performance.
t 1 Fiscal Year Ended Jan. 30, 2000 Jan. 28, 2001 Feb. 3, 2002 Feb. 2, 2003 Feb. 1, 2004 Ratio definitions 1.05 1.39 1.46 1.77 1.63 1.94 1.96 2.36 2.72 3.25 (current assets-inventories)/curr.liab. current assets/curr.liab. 47.96% 32.41% 7.11 2.20 0.00% 0.00% 38.73 1.36 2.47% 2.41% 124.29 1.36 19.46% 16.29% 33.59 1.50 11.26% 10.12% 23.15 1.46 4 LT debt/shareholders' equity LT debt(shareholders' equity + debt) EBIT interest expense total assets/shareholders' equity Liquidity ratios Quick (acid-test) ratio Current ratio Leverage ratios Debt-to equity (book) Debt-to-capital Times interest earned Assets to equity Activity ratios Receivables turnover Inventory turnover Asset turnover Cash turnover Profitability ratios Return on assets Return on equity Operating profit margin Net profit margin 10.81 19.04 2.10 69.19 12.16 20.84 1.75 42.80 10.19 19.61 1.54 18.00 10.61 15.66 1.20 15.26 9.70 17.76 1.01 32.79 sales/accounts receivables cost of goods sold inventory sales/total assets sales/cash and cash equivalents 5.67% 12.47% 4.92% 2.70% 8.59% 11.72% 7.82% 4.90% 10.33% 14.06% 10.62% 6.69% 8.16% 12.25% 12.17% 6.81% 8.64% 12.62% 15.34% 8.58% HI net income/assets net income/shareholders' equity operating incomeet sales net income/sales $ t 1 Fiscal Year Ended Jan. 30, 2000 Jan. 28, 2001 Feb. 3, 2002 Feb. 2, 2003 Feb. 1, 2004 Ratio definitions 1.05 1.39 1.46 1.77 1.63 1.94 1.96 2.36 2.72 3.25 (current assets-inventories)/curr.liab. current assets/curr.liab. 47.96% 32.41% 7.11 2.20 0.00% 0.00% 38.73 1.36 2.47% 2.41% 124.29 1.36 19.46% 16.29% 33.59 1.50 11.26% 10.12% 23.15 1.46 4 LT debt/shareholders' equity LT debt(shareholders' equity + debt) EBIT interest expense total assets/shareholders' equity Liquidity ratios Quick (acid-test) ratio Current ratio Leverage ratios Debt-to equity (book) Debt-to-capital Times interest earned Assets to equity Activity ratios Receivables turnover Inventory turnover Asset turnover Cash turnover Profitability ratios Return on assets Return on equity Operating profit margin Net profit margin 10.81 19.04 2.10 69.19 12.16 20.84 1.75 42.80 10.19 19.61 1.54 18.00 10.61 15.66 1.20 15.26 9.70 17.76 1.01 32.79 sales/accounts receivables cost of goods sold inventory sales/total assets sales/cash and cash equivalents 5.67% 12.47% 4.92% 2.70% 8.59% 11.72% 7.82% 4.90% 10.33% 14.06% 10.62% 6.69% 8.16% 12.25% 12.17% 6.81% 8.64% 12.62% 15.34% 8.58% HI net income/assets net income/shareholders' equity operating incomeet sales net income/sales $Step by Step Solution
There are 3 Steps involved in it
Step: 1

Get Instant Access to Expert-Tailored Solutions
See step-by-step solutions with expert insights and AI powered tools for academic success
Step: 2

Step: 3
Ace Your Homework with AI
Get the answers you need in no time with our AI-driven, step-by-step assistance
Get Started
Personal Finance
Authors: Jack Kapoor, Les Dlabay, Robert J. Hughes, Arshad Ahmad, Jordan Fortino
6th Canadian edition
1259453146, 978-1259453144