Answered step by step
Verified Expert Solution
Link Copied!

Question

1 Approved Answer

Task option 1 1. The primary data on the income (Ls) of the company employees are given: 140, 150, 150, 200, 200, 250, 250, 250,
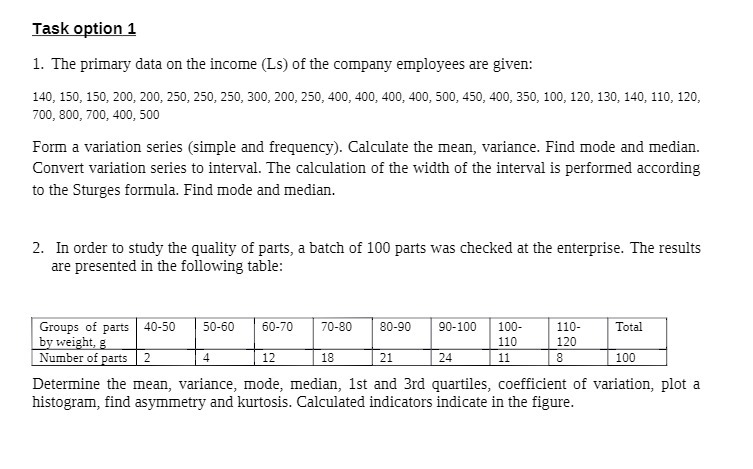
image text in transcribed
Task option 1 1. The primary data on the income (Ls) of the company employees are given: 140, 150, 150, 200, 200, 250, 250, 250, 300, 200, 250, 400, 400, 400, 400, 500, 450, 400, 350, 100, 120, 130, 140, 110, 120, 700, 800, 700, 400, 500 Form a variation series (simple and frequency). Calculate the mean, variance. Find mode and median. Convert variation series to interval. The calculation of the width of the interval is performed according to the Sturges formula. Find mode and median. 2. In order to study the quality of parts, a batch of 100 parts was checked at the enterprise. The results are presented in the following table: Groups of parts 40-50 50-60 60-70 70-80 80-90 90-100 100- 110- Total by weight, g 110 120 Number of parts 2 4 12 18 21 24 11 8 100 Determine the mean, variance, mode, median, Ist and 3rd quartiles, coefficient of variation, plot a histogram, find asymmetry and kurtosis. Calculated indicators indicate in the figure

Step by Step Solution

There are 3 Steps involved in it

Step: 1

blur-text-image

Get Instant Access to Expert-Tailored Solutions

See step-by-step solutions with expert insights and AI powered tools for academic success

Step: 2

blur-text-image

Step: 3

blur-text-image

Ace Your Homework with AI

Get the answers you need in no time with our AI-driven, step-by-step assistance

Get Started

Recommended Textbook for

Advanced Engineering Mathematics

Authors: ERWIN KREYSZIG

9th Edition

0471488852, 978-0471488859

More Books

Students also viewed these Mathematics questions

Question

Graph the given system of inequalities. x-4y -8 2x - 8y 0

Answered: 1 week ago

Question

=+ d. Income per worker in Richland is actually

Answered: 1 week ago