Answered step by step
Verified Expert Solution
Link Copied!

Question

1 Approved Answer

Task Print Analyzing Bivariate Data In this activity, you will draw a scatter plot and the line of best fit to analyze a situation. Jeremy
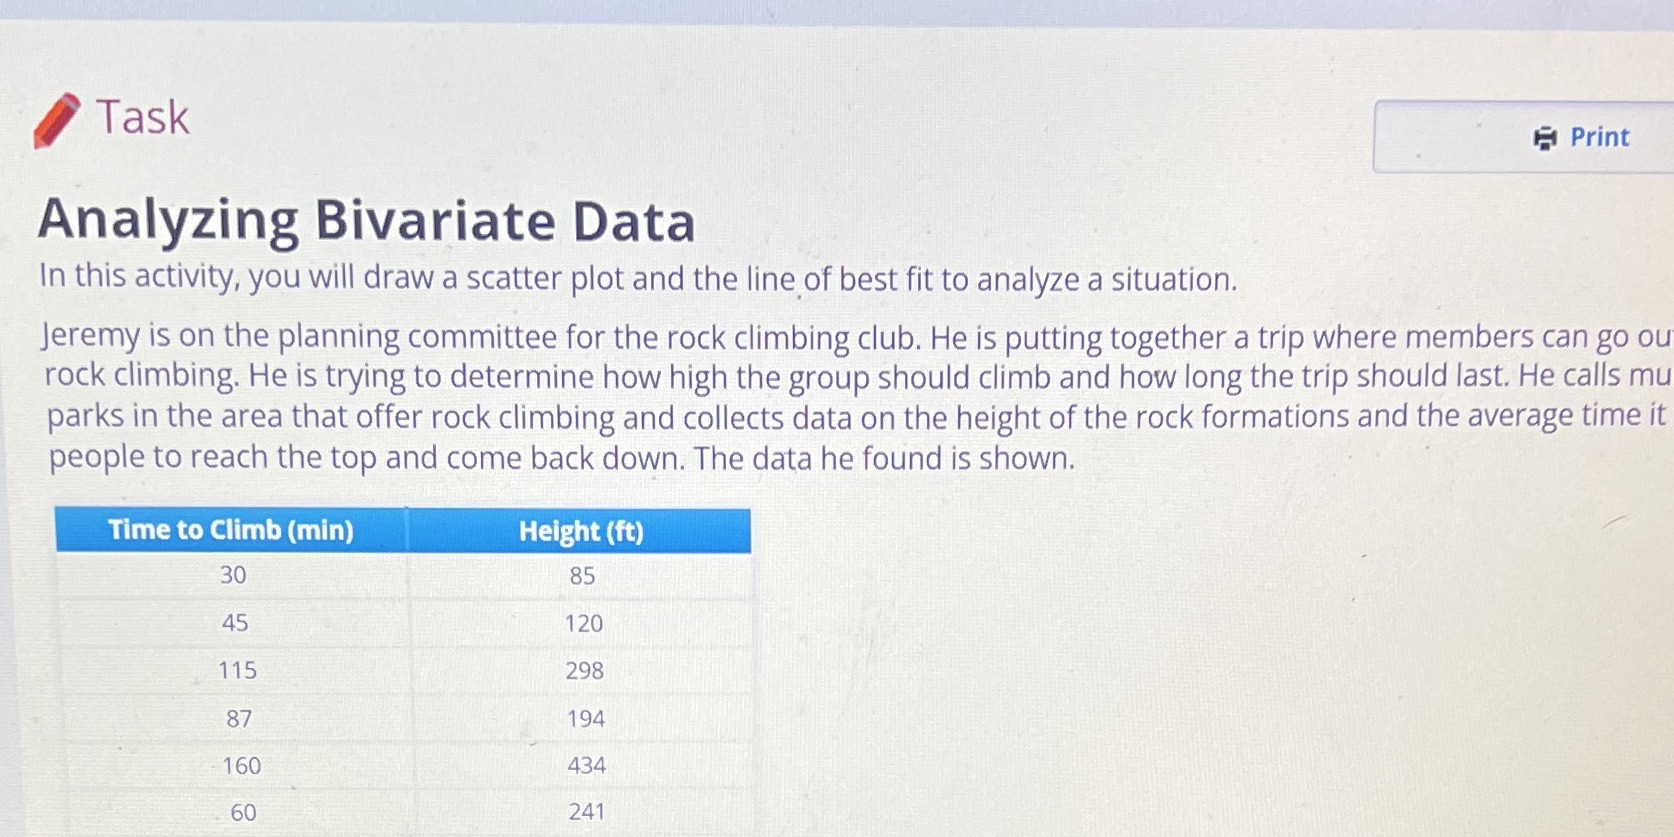
image text in transcribed
Task Print Analyzing Bivariate Data In this activity, you will draw a scatter plot and the line of best fit to analyze a situation. Jeremy is on the planning committee for the rock climbing club. He is putting together a trip where members can go ou rock climbing. He is trying to determine how high the group should climb and how long the trip should last. He calls mu parks in the area that offer rock climbing and collects data on the height of the rock formations and the average time it people to reach the top and come back down. The data he found is shown. Time to Climb (min) Height (ft) 30 85 45 120 115 298 87 194 160 434 60 241

Step by Step Solution

There are 3 Steps involved in it

Step: 1

blur-text-image

Get Instant Access to Expert-Tailored Solutions

See step-by-step solutions with expert insights and AI powered tools for academic success

Step: 2

blur-text-image

Step: 3

blur-text-image

Ace Your Homework with AI

Get the answers you need in no time with our AI-driven, step-by-step assistance

Get Started

Recommended Textbook for

An Introduction to Analysis

Authors: William R. Wade

4th edition

132296381, 978-0132296380

More Books

Students also viewed these Mathematics questions