Answered step by step
Verified Expert Solution
Link Copied!

Question

1 Approved Answer

Task Use the following information below: BBF Inc. Balance Sheet at 31/12/2017 & 31/12/2018 Assets 2017 2018 Cash $200 $150 Account receivable 450 425 Inventory
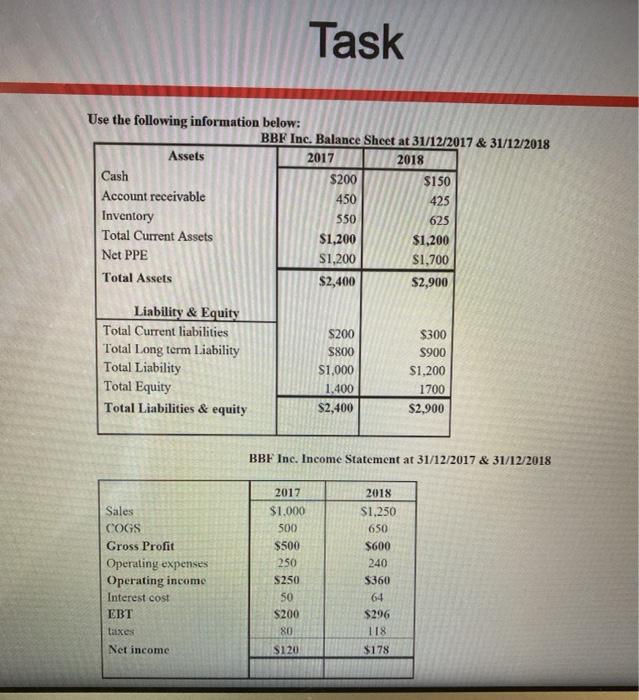
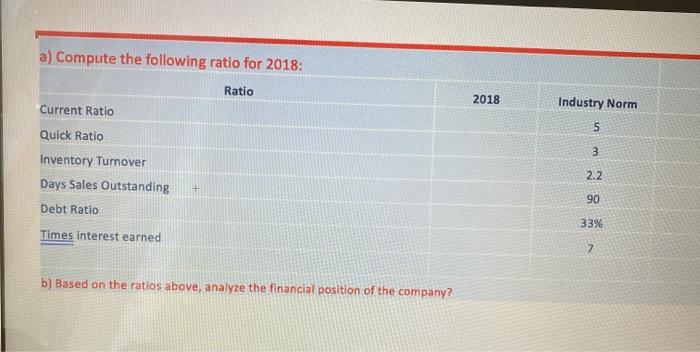
image text in transcribed
Task Use the following information below: BBF Inc. Balance Sheet at 31/12/2017 & 31/12/2018 Assets 2017 2018 Cash $200 $150 Account receivable 450 425 Inventory 550 625 Total Current Assets $1,200 $1,200 Net PPE S1,200 $1,700 Total Assets $2,400 $2,900 Liability & Equity Total Current liabilities Total Long term Liability Total Liability Total Equity Total Liabilities & equity S200 S800 $1,000 1.400 $2,400 $300 900 $1,200 1700 $2,900 BBF Inc. Income Statement at 31/12/2017 & 31/12/2018 Sales COGS Gross Profit Operating expenses Operating income Interest cos! taxes Net income 2017 $1.000 500 $500 250 S250 SO $200 80 S120 2018 $1,250 650 $600 240 $360 64 $296 118 $178 a) Compute the following ratio for 2018: Ratio 2018 Current Ratio Industry Norm 5 3 Quick Ratio Inventory Turnover Days Sales Outstanding 2.2 90 Debt Ratio 33% Times interest earned 7 b) Based on the ratios above, analyze the financial position of the company

Step by Step Solution

There are 3 Steps involved in it

Step: 1

blur-text-image

Get Instant Access to Expert-Tailored Solutions

See step-by-step solutions with expert insights and AI powered tools for academic success

Step: 2

blur-text-image

Step: 3

blur-text-image

Ace Your Homework with AI

Get the answers you need in no time with our AI-driven, step-by-step assistance

Get Started

Recommended Textbook for

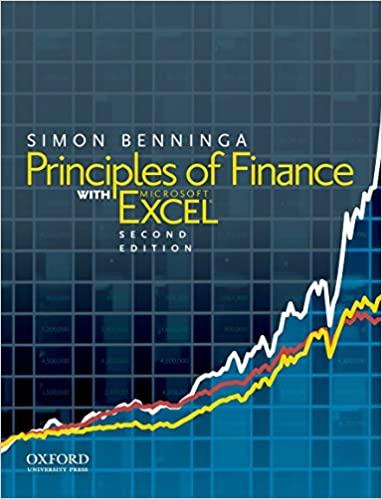
Principles Of Finance With Excel

Authors: Simon Benninga

2nd Edition

0199755477, 9780199755479

More Books

Students also viewed these Finance questions