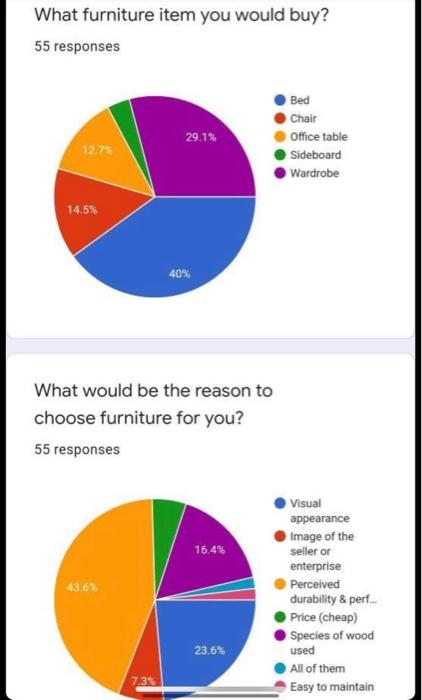
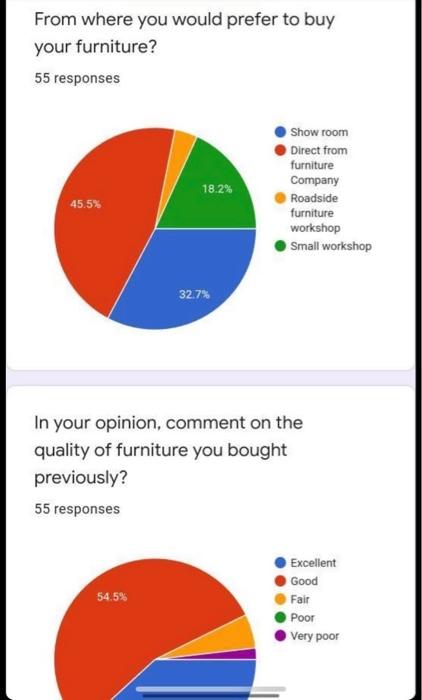
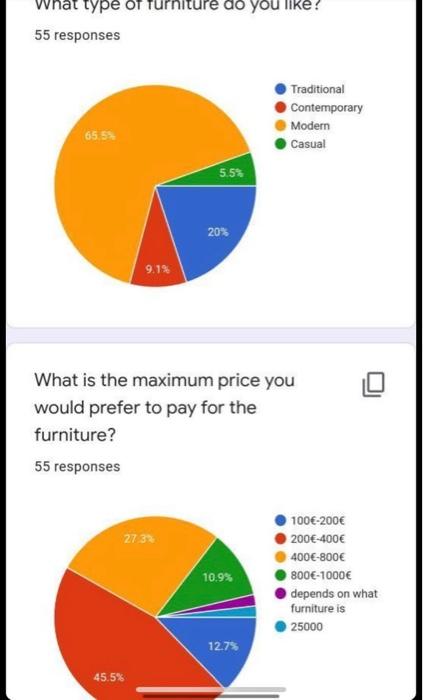
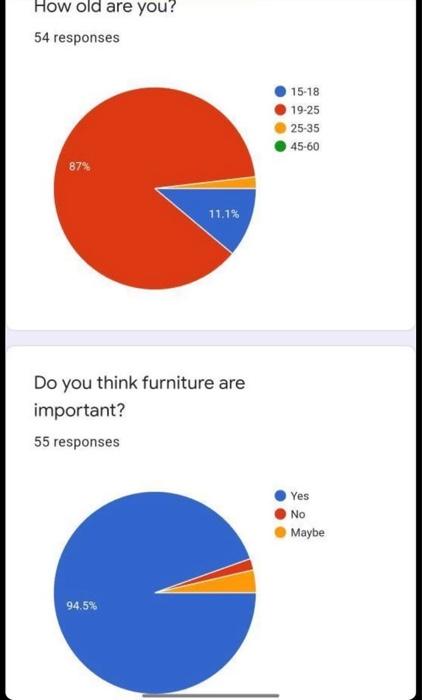
Tasks for the data analysis: 1) Compute the mean and median for the data whenever possible and interpret the results. 2) Use appropriate visualization tools in spreadsheet for each question (Bar plot, Pie Chart Histogram, Scatterplot, etc.) or a combination of two data sets or more and report them. You can use tables to summarize the findings (i.e., combine one or two questions or more). 3) Pivot tables are one of spreadsheet's most powerful and widely used features. Create a minimum of 3 pivot tables (two columns or multiple columns) in your dataset and report the findings. 4) Find relationships between the different indicators you're tracking. Where can you use a tool such as correlation or covariance on the gathered data? Calculate and report for at least 2 pairs of variables. 5) Apply and interpret What-lf Analysis, COUNTIF, and VLOOKUP or any other specialized functions on a couple of variables/questions in your data set (Minimum of 2 applications). Be creative in designing and using these functions. 6) Any conclusions or recommendations you make must be backed by analysis conducted in the spreadsheet on your data or research. 3) Product/Marketing / Sales Strategy: a) Analyze and present the data gathered from your survey b) Create charts (Excel) for presentation c) Define the four Ps as it relates to this business plan. Product, Price, Place, Promotion i) Make sure to fully discuss the data analysis on which you base your recommendations What furniture item you would buy? 55 responses 29.1% Bed Chair Office table Sideboard Wardrobe 12.7% 14,5% 40% What would be the reason to choose furniture for you? 55 responses 16.4% 43.63 Visual appearance Image of the seller or enterprise Perceived durability & perf Price (cheap) Species of wood used All of them Easy to maintain 23.6% 3% From where you would prefer to buy your furniture? 55 responses 18.2% Showroom Direct from furniture Company Roadside furniture workshop Small workshop 45.5% 32.7% In your opinion, comment on the quality of furniture you bought previously? 55 responses Excellent Good 54.5% Fair Poor Very poor What type of furniture do you like! 55 responses Traditional Contemporary Modern Casual 65.5% 5.5% 20% 9.1% What is the maximum price you would prefer to pay for the furniture? 55 responses 273 10.9% 100-200 200-400 400-800 800-1000 depends on what furniture is 25000 12.75 45.5% How old are you? 54 responses 15-18 19-25 25-35 45-60 87% 11.1% Do you think furniture are important? 55 responses Yes No Maybe 94.5%
