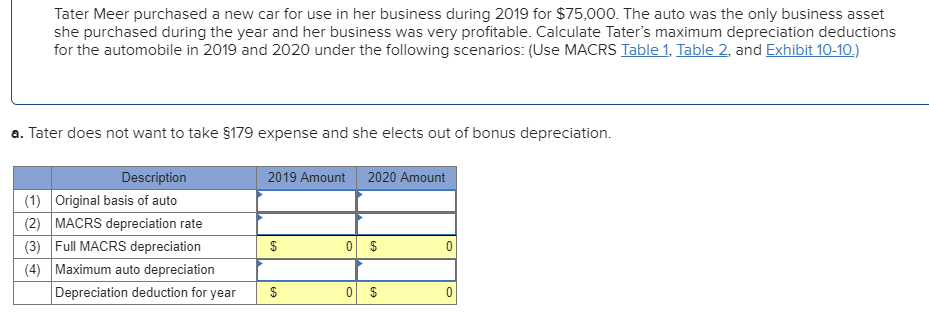
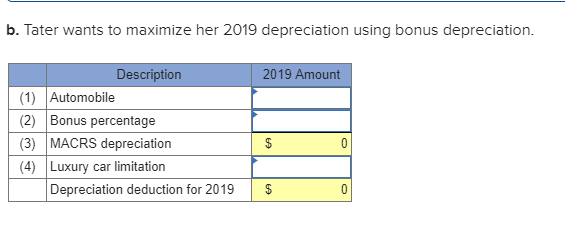
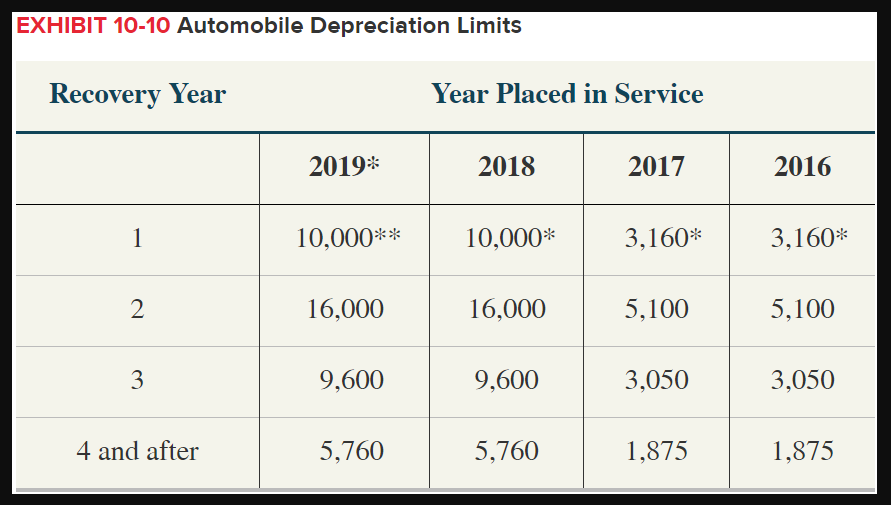
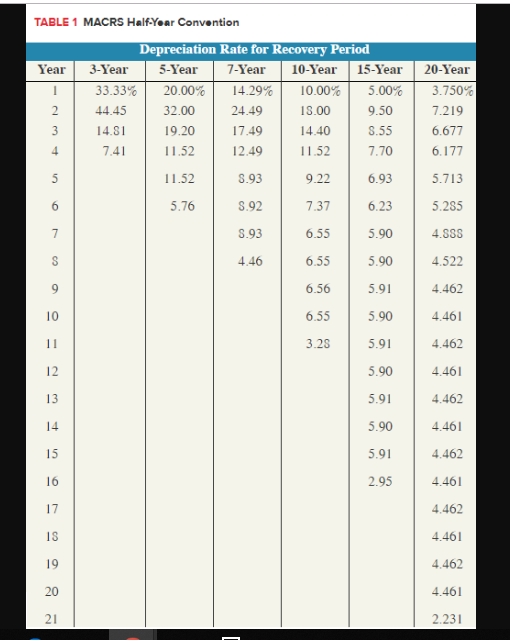
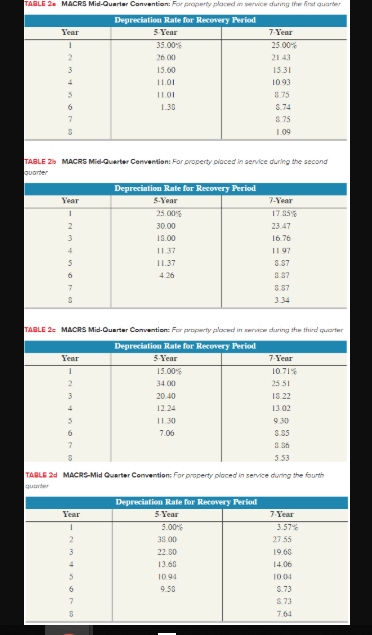
Tater Meer purchased a new car for use in her business during 2019 for $75,000. The auto was the only business asset she purchased during the year and her business was very profitable. Calculate Tater's maximum depreciation deductions for the automobile in 2019 and 2020 under the following scenarios: (Use MACRS Table 1, Table 2, and Exhibit 10-10) a. Tater does not want to take S179 expense and she elects out of bonus depreciation Description 2020 Amount 2019 Amount (1) Original basis of auto (2) MACRS depreciation rate (3) Full MACRS depreciation (4) Maximum auto depreciation Depreciation deduction for year $ b. Tater wants to maximize her 2019 depreciation using bonus depreciation. Description 2019 Amount (1) Automobile (2) Bonus percentage (3) MACRS depreciation (4) Luxury car limitation Depreciation deduction for 2019 EXHIBIT 10-1O Automobile Depreciation Limits Recovery Year Year Placed in Service 2019 2017 2018 2016 10,000** 3,160* 3,160* 10,000* 16,000 16,000 2 5,100 5,100 9,600 9,600 3 3,050 3,050 4 and after 5,760 1,875 5,760 1,875 TABLE 1 MACRS HalfYear Convention Depreciation Rate for Recovery Period 5-Year Year 3-Year 7-Year 10-Year 15-Year 20-Year 33.33% 5.00% 3.750% 20.00% 14.29% 10.00% 32.00 13.00 2 44.45 24.49 9.50 7.219 3 14.81 19.20 17.49 14.40 S.55 6.677 11.52 6.177 7,4 11.52 12.49 7.70 5 11.52 S.93 9.22 6.93 5.713 6 5.76 S.92 7.37 6.23 5.285 7 S.93 6.55 5.90 4.888 4.46 6.55 5.90 4.522 4.462 6.56 5.91 10 6.55 5,90 4.46 11 3.28 5.91 4.462 12 5.90 4.46 13 5.91 4.462 5.90 14 4.46 15 5.91 4.462 2.95 16 4.461 17 4.462 4.461 19 4.462 20 4.461 21 2.23 TABLE 2 MACRS Mid-Quarter Convantion: For property placed in service duning the frst quarter Depreciation Rate for Recovery Period Year 7 Year 5Year 35.00% 25.00% 26 00 2 21 43 15.60 15.31 11.01 1093 11.01 875 1.30 8.74 875 109 TABLE 2 MACRS Mid-Quarter Convention: For property placed in service during the second quarter Depreciation Rate for Recovery Period Year 5-Year 7-Year 25.00% 17 S5% 30.00 23.47 18.00 1676 1137 11 97 S.37 5 11.37 4 26 S7 887 3.34 TABLE 2 MACRS Mid-Quarter Comvantion: For property plocwd in serice during the thircd quarter Depreciation Rate for Recovery Period 7.Year 5Year Year 15.00% 10.71% 2 25.51 34.00 20.40 I822 12.24 13.02 11.30 930 7.06 8.35 7 8 S6 3.53 TABLE 2d MACRS-Mid Quarter Comvention: Forproperty placed in service during the fourth qugrter Depreciation Rate for Recovery Period Year 5 Year 7.Year 5.00% 3.57% 33 00 27 55 22.80 19.68 13.68 14.06 5 1094 1004 9.50 S.73 873 7.64 Tater Meer purchased a new car for use in her business during 2019 for $75,000. The auto was the only business asset she purchased during the year and her business was very profitable. Calculate Tater's maximum depreciation deductions for the automobile in 2019 and 2020 under the following scenarios: (Use MACRS Table 1, Table 2, and Exhibit 10-10) a. Tater does not want to take S179 expense and she elects out of bonus depreciation Description 2020 Amount 2019 Amount (1) Original basis of auto (2) MACRS depreciation rate (3) Full MACRS depreciation (4) Maximum auto depreciation Depreciation deduction for year $ b. Tater wants to maximize her 2019 depreciation using bonus depreciation. Description 2019 Amount (1) Automobile (2) Bonus percentage (3) MACRS depreciation (4) Luxury car limitation Depreciation deduction for 2019 EXHIBIT 10-1O Automobile Depreciation Limits Recovery Year Year Placed in Service 2019 2017 2018 2016 10,000** 3,160* 3,160* 10,000* 16,000 16,000 2 5,100 5,100 9,600 9,600 3 3,050 3,050 4 and after 5,760 1,875 5,760 1,875 TABLE 1 MACRS HalfYear Convention Depreciation Rate for Recovery Period 5-Year Year 3-Year 7-Year 10-Year 15-Year 20-Year 33.33% 5.00% 3.750% 20.00% 14.29% 10.00% 32.00 13.00 2 44.45 24.49 9.50 7.219 3 14.81 19.20 17.49 14.40 S.55 6.677 11.52 6.177 7,4 11.52 12.49 7.70 5 11.52 S.93 9.22 6.93 5.713 6 5.76 S.92 7.37 6.23 5.285 7 S.93 6.55 5.90 4.888 4.46 6.55 5.90 4.522 4.462 6.56 5.91 10 6.55 5,90 4.46 11 3.28 5.91 4.462 12 5.90 4.46 13 5.91 4.462 5.90 14 4.46 15 5.91 4.462 2.95 16 4.461 17 4.462 4.461 19 4.462 20 4.461 21 2.23 TABLE 2 MACRS Mid-Quarter Convantion: For property placed in service duning the frst quarter Depreciation Rate for Recovery Period Year 7 Year 5Year 35.00% 25.00% 26 00 2 21 43 15.60 15.31 11.01 1093 11.01 875 1.30 8.74 875 109 TABLE 2 MACRS Mid-Quarter Convention: For property placed in service during the second quarter Depreciation Rate for Recovery Period Year 5-Year 7-Year 25.00% 17 S5% 30.00 23.47 18.00 1676 1137 11 97 S.37 5 11.37 4 26 S7 887 3.34 TABLE 2 MACRS Mid-Quarter Comvantion: For property plocwd in serice during the thircd quarter Depreciation Rate for Recovery Period 7.Year 5Year Year 15.00% 10.71% 2 25.51 34.00 20.40 I822 12.24 13.02 11.30 930 7.06 8.35 7 8 S6 3.53 TABLE 2d MACRS-Mid Quarter Comvention: Forproperty placed in service during the fourth qugrter Depreciation Rate for Recovery Period Year 5 Year 7.Year 5.00% 3.57% 33 00 27 55 22.80 19.68 13.68 14.06 5 1094 1004 9.50 S.73 873 7.64


