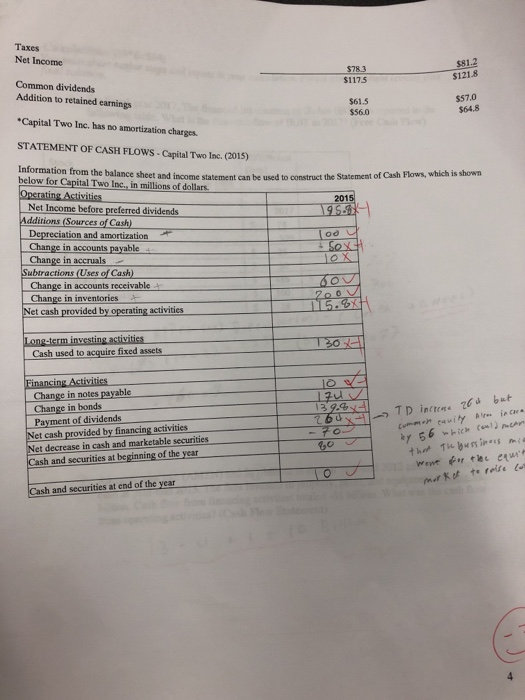
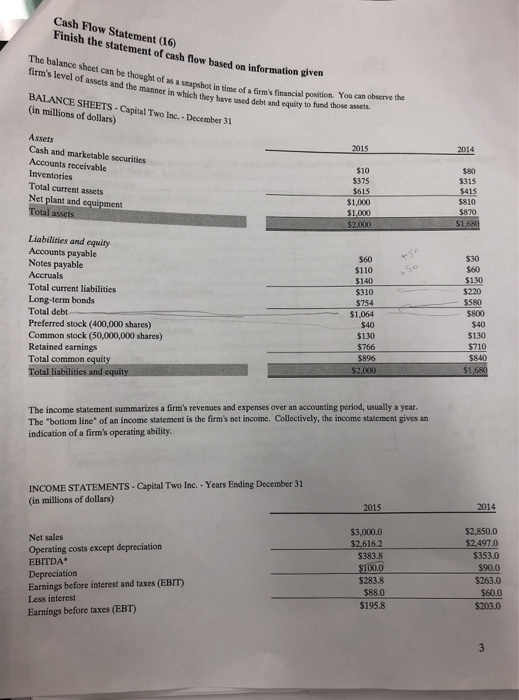
Taxes Net Income 81.2 $121.8 $1175 Common dividends Addition to retained earnings Capital Two Inc. has no amortization charges. STATEMENT OF CASH FLOWS - Capital Two Inc. (2015) below for Capital Two Inc., in millions of dollars $57.0 $64.8 $61.5 $56.0 on from the balance sheet and income statement can be used to construct the Statement of Cash Flows, which is shown 201 Net Income before preferred dividends Additions (Sources of Cash) Depreciation and amortization Change in accounts payable Change in accruals Change in accounts receivable Change in inventories Net cash provided by operating activities Cash used to acquire fixed assets Change in notes payable Change in bonds Payment of dividends d but Net cash provided by financing activities Net decrease in cash and marketable securities Cash and securities at beginning of the year Cash and securities at end of the year Cash Flow Statement (16 Finish the statement of cash flow based on information given The balance sheet can be thought firm's level of assets and the of as a snapshot in time of a firm's financial position. manner in which they have used debt and equity to fund those asses. You can observe the they have BALANCE SHEETS (in millions of dollars) Capital Two Inc.-December 31 Cash and marketable securities Accounts receivable Inventories Total current assets Net plant and equipment $10 375 $315 15 $810 $1,000 Liabilities and equity Accounts payable Notes payable Accruals Total current liabilities Long-term bonds Total debt Preferred stock (400,000 shares) Common stock (50,000,000 shares) Retained earnings Total common equity $30 $60 $60 $110 130 $220 $140 $310 $754 $1,064$580 $40 $40 $130 $130 The income statement summarizes a firm's revenues and expenses over an accounting period, usually a year. The "bottom line" of an income statement is the firm's net income. Collectively, the income statement gives an indication of a firm's operating ability INCOME STATEMENTS - Capital Two Inc. - Years Ending December 31 (in millions of dollars) 2014 2015 $2,850.0 $3,000.0 $2,616.2 $383.8 Net sales Operating costs except depreciation EBITDA Depreciation Earnings before interest and taxes (EBIT) $353.0 $263.0 $283.8 $203.0 $195.8 Less interest Earnings before taxes (EBT)


