Answered step by step
Verified Expert Solution
Link Copied!

Question

1 Approved Answer

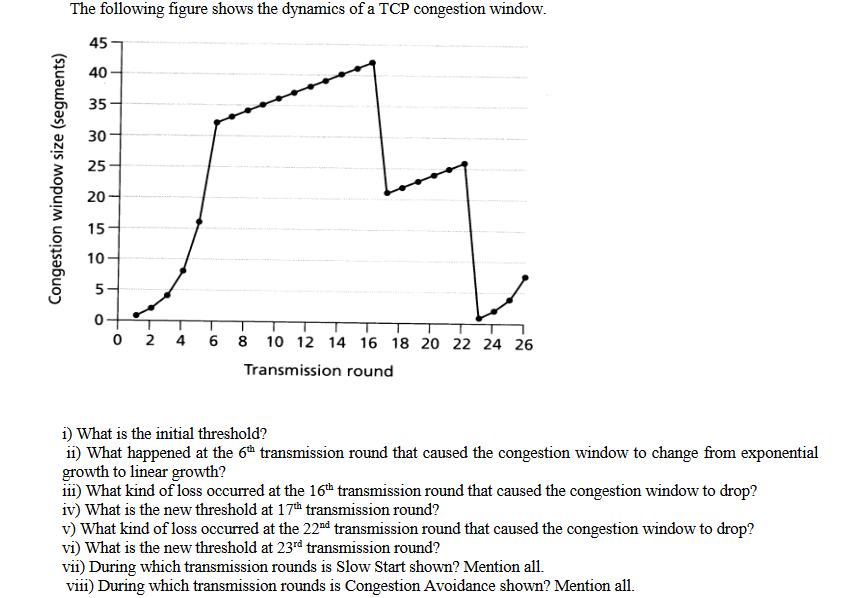
TCP congestion window The following figure shows the dynamics of a TCP congestion window 45 40 35 30 3 25- 15 S 10- 0 0

TCP congestion window

image text in transcribed

The following figure shows the dynamics of a TCP congestion window 45 40 35 30 3 25- 15 S 10- 0 0 2 4 6 8 10 12 14 16 18 20 22 24 26 Transmission round i) What is the initial threshold? ii) What happened at the 6h transmission round that caused the congestion window to change from exponential growth to linear growth? iii) What kind of loss occurred at the 16th transmission round that caused the congestion window to drop? iv) What is the new threshold at 17th transmission round? v) What kind of loss occurred at the 22d transmission round that caused the congestion window to drop? vi) What is the new threshold at 23rd transmission round? vii) During which transmission rounds is Slow Start shown? Mention all viii) During which transmission rounds is Congestion Avoidance shown? Mention all

Step by Step Solution

There are 3 Steps involved in it

Step: 1

blur-text-image

Get Instant Access to Expert-Tailored Solutions

See step-by-step solutions with expert insights and AI powered tools for academic success

Step: 2

blur-text-image

Step: 3

blur-text-image

Ace Your Homework with AI

Get the answers you need in no time with our AI-driven, step-by-step assistance

Get Started

Recommended Textbook for

More Books

Students also viewed these Databases questions