Answered step by step
Verified Expert Solution
Question
1 Approved Answer
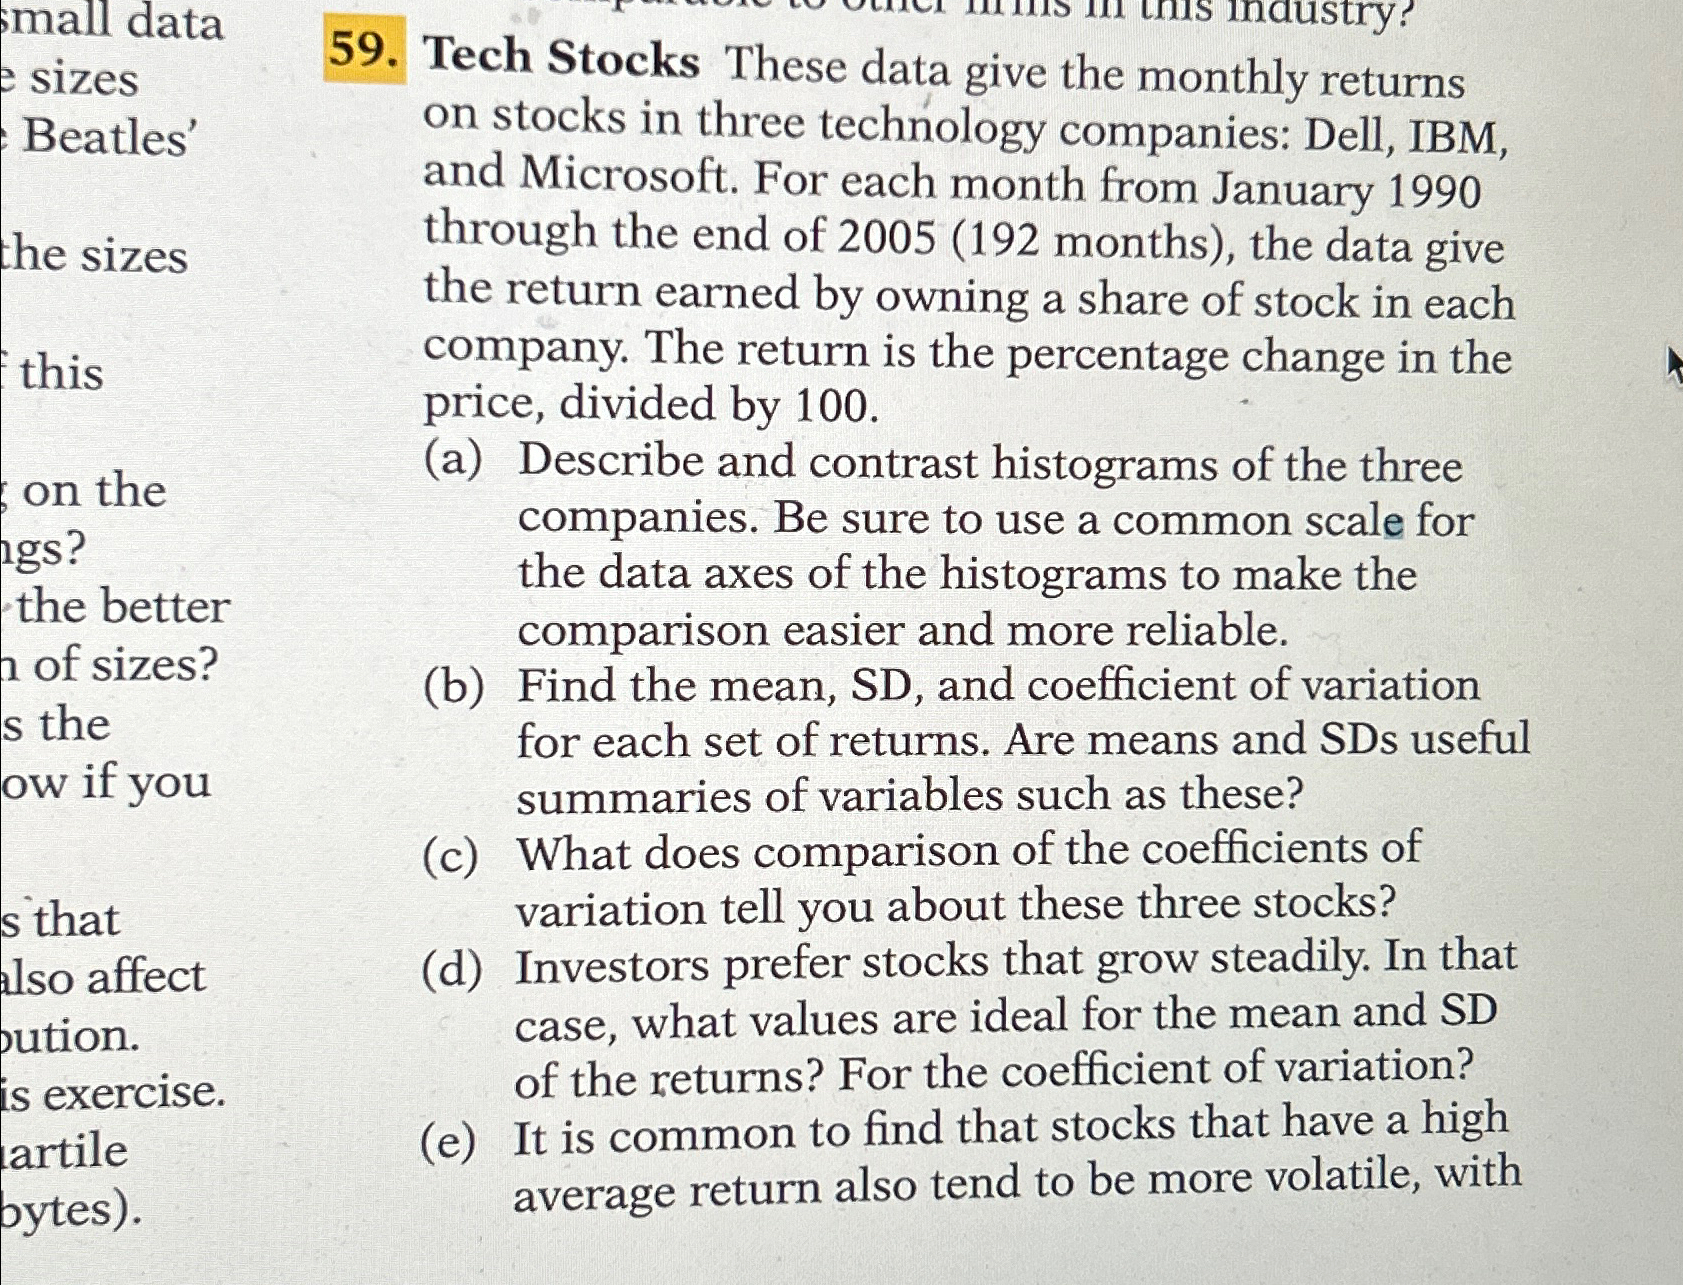
Tech Stocks These data give the monthly returns on stocks in three technology companies: Dell, IBM, and Microsoft. For each month from January 1 9
Tech Stocks These data give the monthly returns on stocks in three technology companies: Dell, IBM, and Microsoft. For each month from January through the end of months the data give the return earned by owning a share of stock in each company. The return is the percentage change in the price, divided by
a Describe and contrast histograms of the three companies. Be sure to use a common scale for the data axes of the histograms to make the comparison easier and more reliable.
b Find the mean, SD and coefficient of variation for each set of returns. Are means and SDs useful summaries of variables such as these?
c What does comparison of the coefficients of variation tell you about these three stocks?
d Investors prefer stocks that grow steadily. In that case, what values are ideal for the mean and SD of the returns? For the coefficient of variation?
e It is common to find that stocks that have a high average return also tend to be more volatile, with

Step by Step Solution
There are 3 Steps involved in it
Step: 1

Get Instant Access to Expert-Tailored Solutions
See step-by-step solutions with expert insights and AI powered tools for academic success
Step: 2

Step: 3

Ace Your Homework with AI
Get the answers you need in no time with our AI-driven, step-by-step assistance
Get Started


