

Question
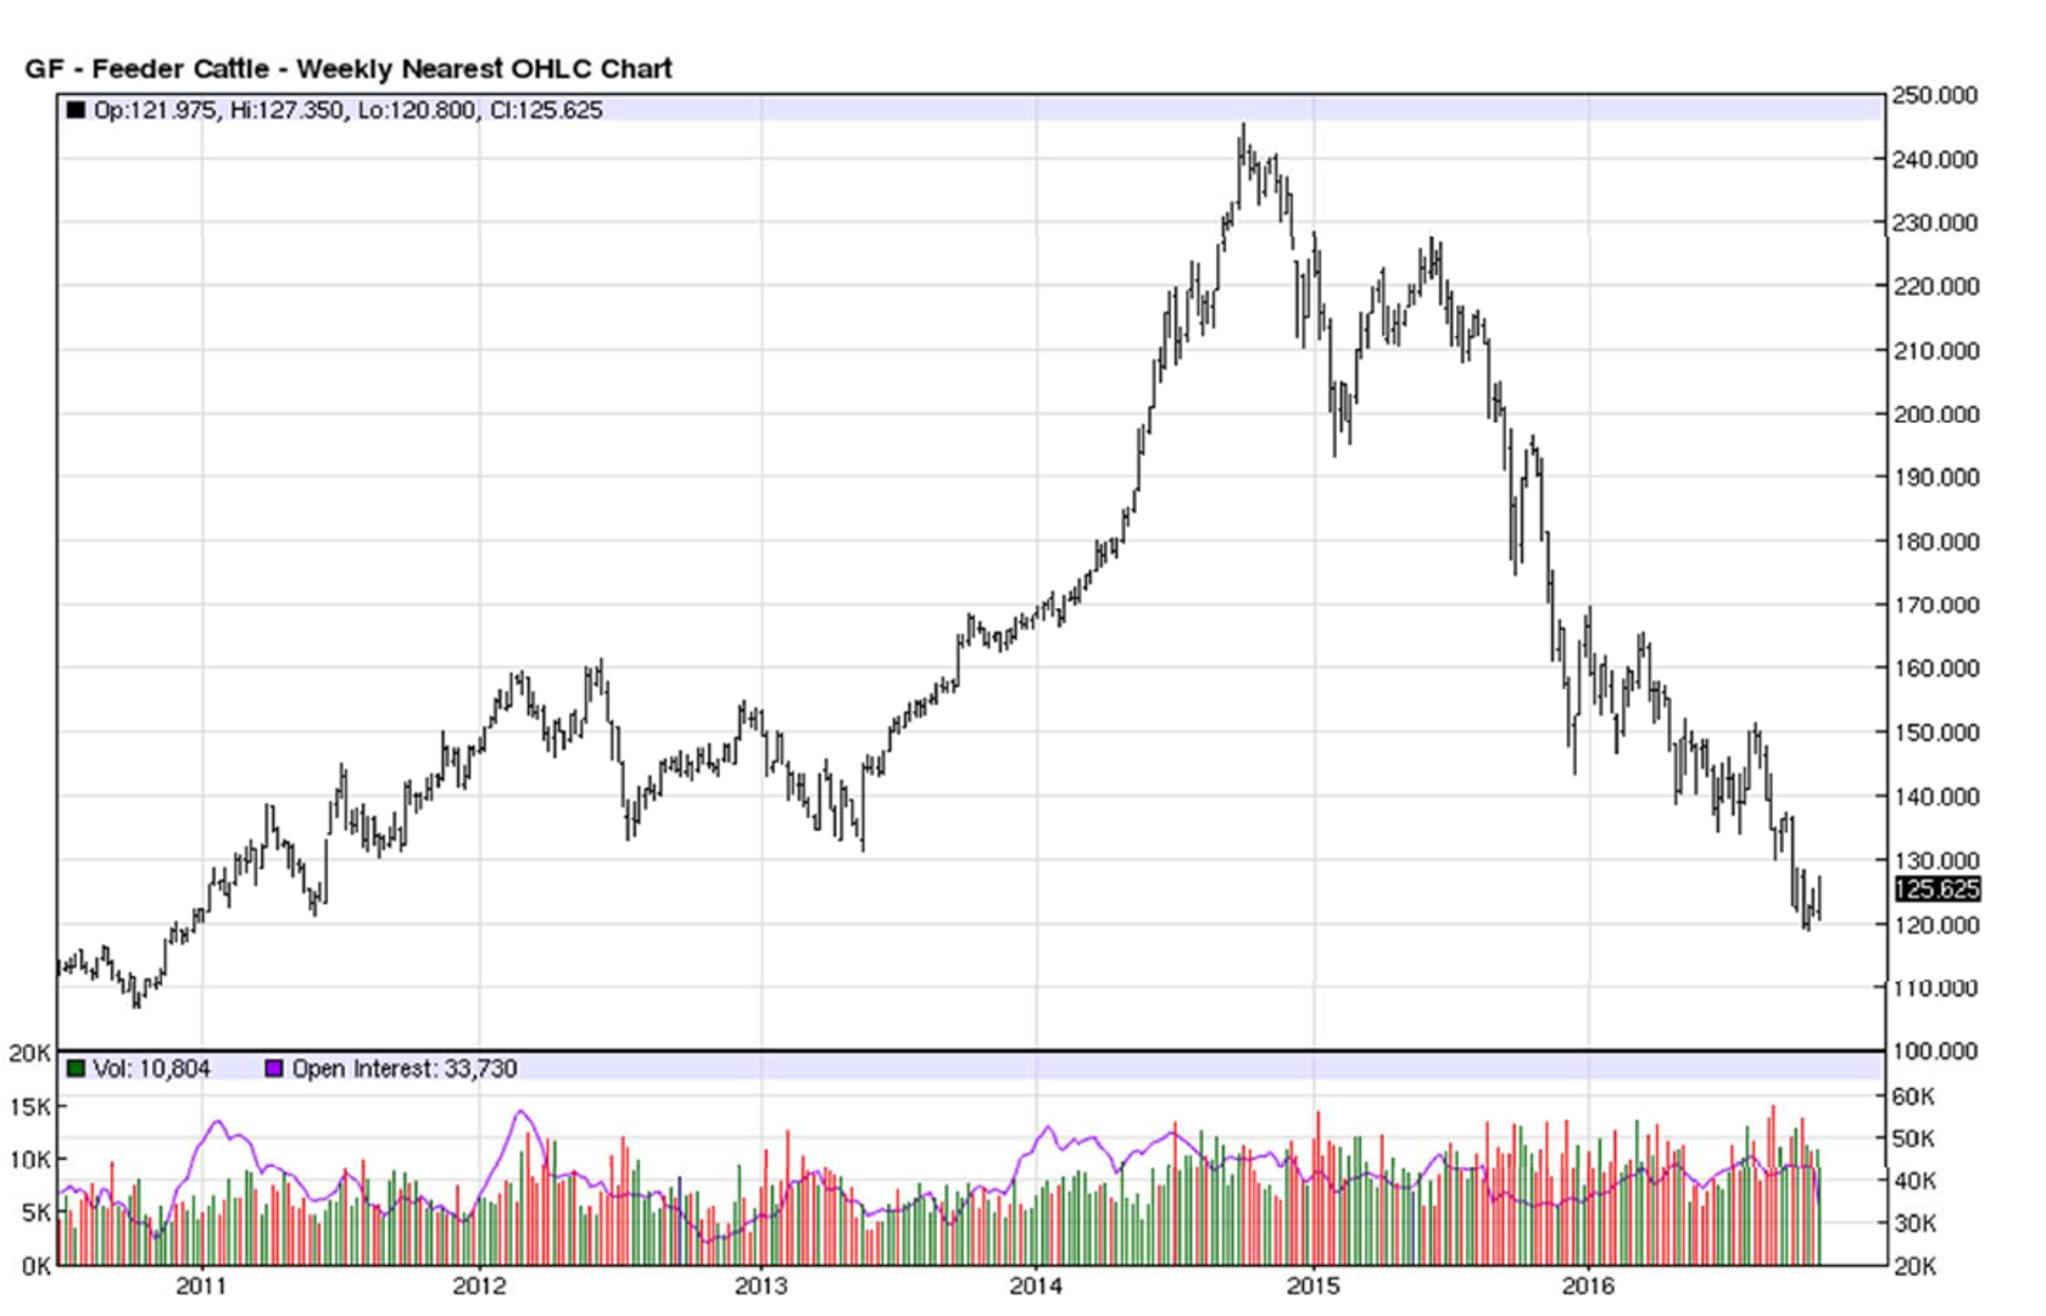
Technical Analysis - Using the attached Weekly-Nearest Feeder Cattle Contract prices chart answer the following questions. Prices are as of November 4, 2016. Ensure you
Technical Analysis - Using the attached Weekly-Nearest Feeder Cattle Contract prices chart answer the following questions. Prices are as of November 4, 2016. Ensure you label your responses on the graph accordingly.
A. Identify any support formed in 2010-13 that are in place at the end of 2016. What are the price levels?
B. What does the technical picture communicate about the likely direction of feeder cattle price movements? Do you have recommendations? (The correct answer uses technical information.) Explain your answer in detail.
Step by Step Solution
There are 3 Steps involved in it
Step: 1

Get Instant Access to Expert-Tailored Solutions
See step-by-step solutions with expert insights and AI powered tools for academic success
Step: 2

Step: 3
Ace Your Homework with AI
Get the answers you need in no time with our AI-driven, step-by-step assistance
Get Started
Benchmarking Islamic Finance
Authors: Mohd Ma'Sum Billah
1st Edition
0367546469, 978-0367546465