

Question: ( technology forecasting) can u tell me what method/ model used in this report, need only two. choose from this one https://pdfs.semanticscholar.org/fede/a35685428f15a3a7a32db5b96f232e0dcda3.pdf?_ga= Technology Forecasting: A
( technology forecasting)
can u tell me what method/ model used in this report, need only two.

 choose from this one
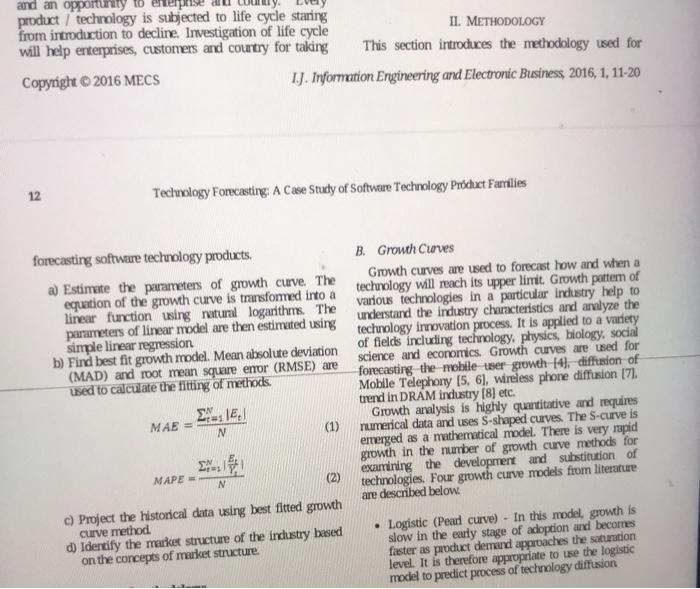
https://pdfs.semanticscholar.org/fede/a35685428f15a3a7a32db5b96f232e0dcda3.pdf?_ga=
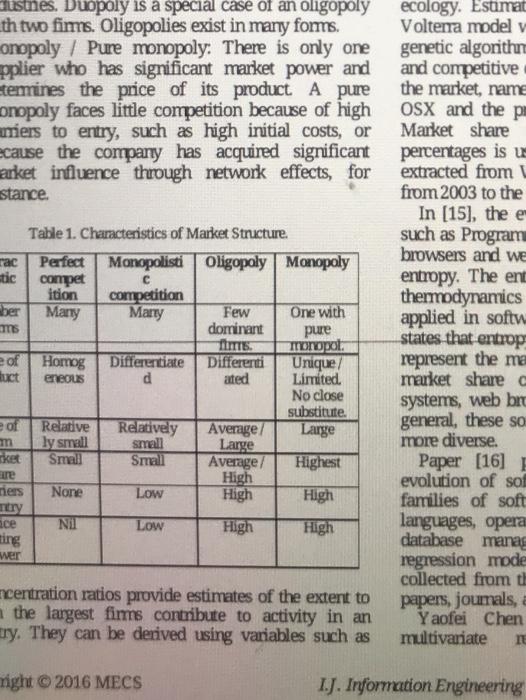
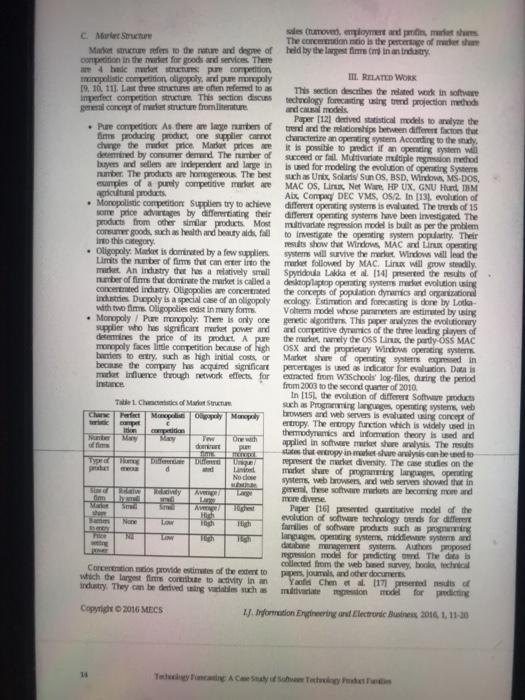
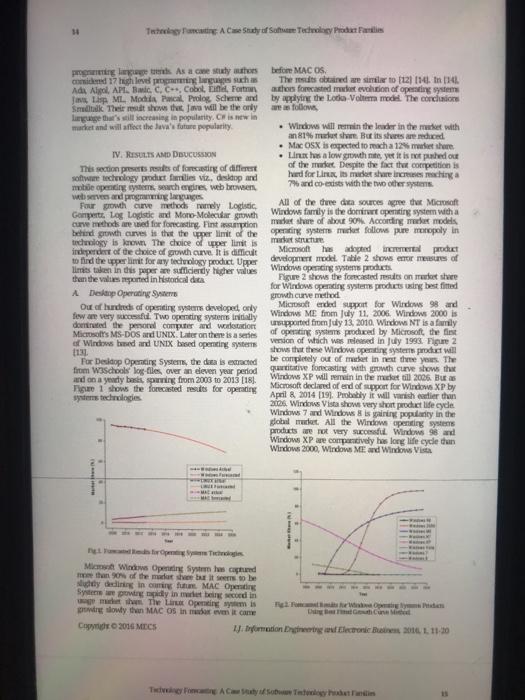
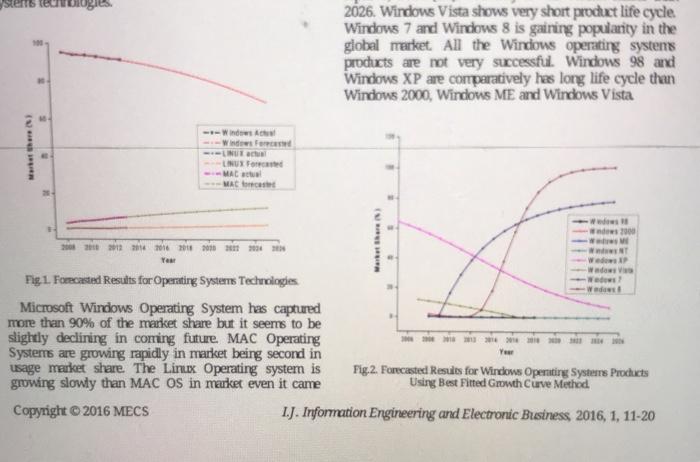
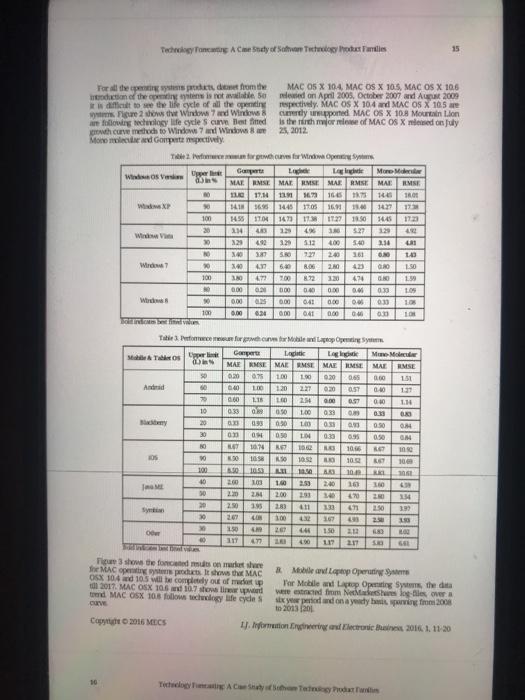
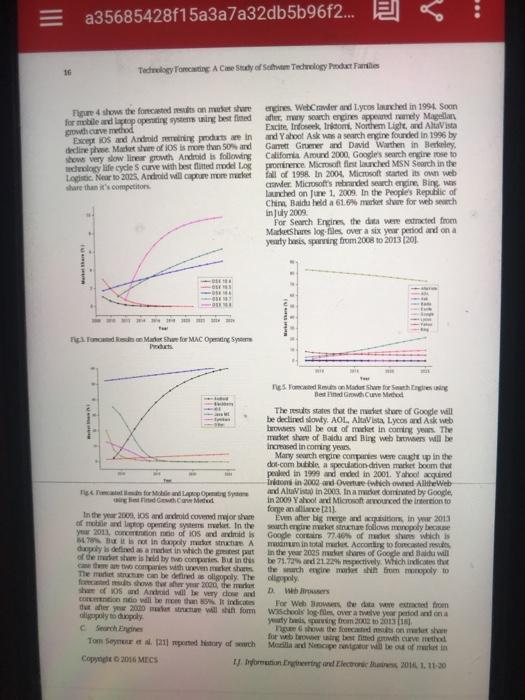
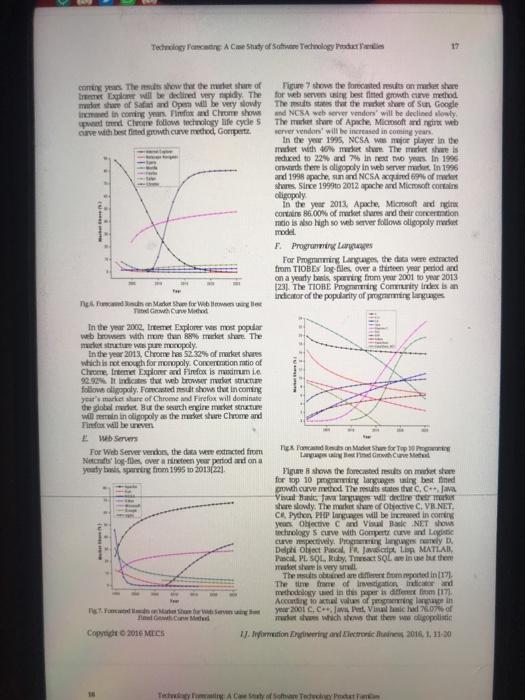
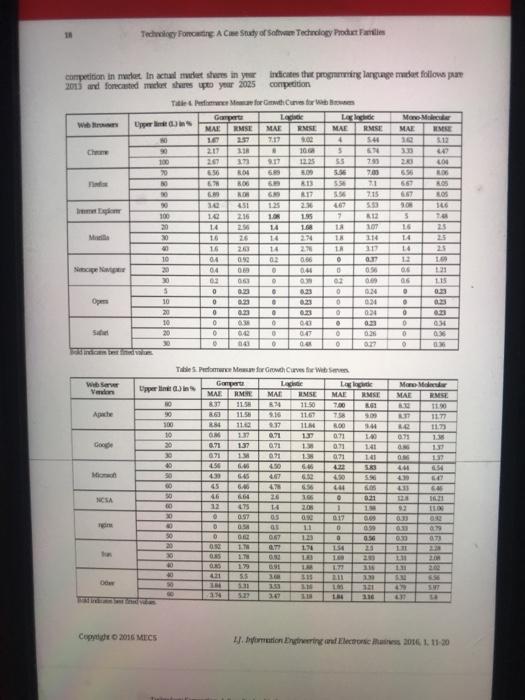
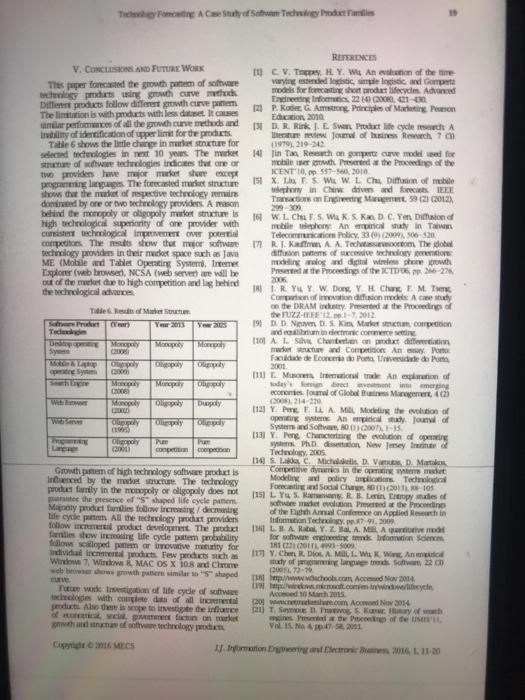
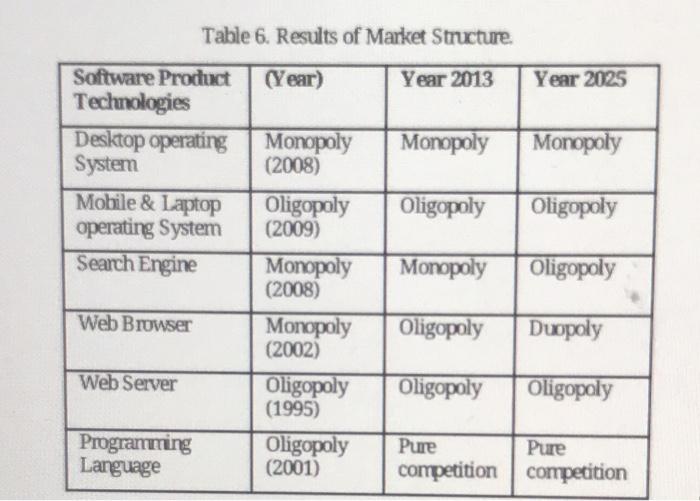
Technology Forecasting: A Case Study of Software Technology Product Families Amal C. Adathe, Ahhursinh V. Surve Raportin e of Technology, and MS India Erwin the mil.com Gopalomaran T. Thumpi Dept. of IT. TSEC, Bach, Mattel, MS, India E-mahoo.com Aht With Image of computers, ir decision about the policies optional activities and Communication technologie some of investment plans etc. Product life cycle is a tool to help technologies pats become part of weryday life. on to form the competition in Many reports shows the use of desilop and mobile the PLC Concept ested to different aplication on system with mines web browser, web as such as com diven les phim we w programming languages are sing podstrology products Industrial products Tipidly. This paper focuses on foncting them the most common product life cycle punem is the of selected software technology product families ning classical, bell-shaped, but it is not the sole se det store as indicator Resis of four growth curve Technology forecasting predicts technological method wy Logistic Gompertz, Log Logistic and trends such as the direction and the rate of technological More Molecular e compared wing MAD and RMSE development. The primary function of forecasting is to For the period under consideration predict the future using a welove in and More mujority software product files following 100 methods of ecology forcasting developed and decin growth potem Restits indicate that incestry applied by others. Growth aralysis is highly aspetive technology product in dominated by quantitative and quas numerical data and few provides for your 2005. Monopoly or oligopoly shaped curves. In liten growth ces are often used et structure will lead to log incing period for for modeling product lifecycle Growth curves (the fint the top provide derivative of the product lidecycle curve are widely used in technology forecasting 11 Ini Terme-Software technology products Product This paper focuses on forecasting life cycle of selected life cycle Growth curves. Miesto software technology product families growth curve methods. In this paper we have focused on different software colores vides top and mobile L INTRODUCTION penting such engines webwe, web Technologies tuve a significant impact on all aspects ve and the software of life. The global society and economy is undergoing a products are shows OS me of fundamental nometion because of advances in incremental products. The indicatored for forecasting egies. Today's marketplace is highly influenced is the market shurd in peceta Four by domowdogical che, dobilisation Logistic (Pea Rot, Gompert. Locistic and More methods of growth curves an experimente me and increased use of software technologies. Today's one facing the tales competition Molecul. The obtivo dentify the met structure of the selected are technology arduracions should strive to customs by Outperforming their competitors Softwa chrology product families petit compare also fading this problem The rest of the personas follows Section 2 Compresory need to improve their sofie is about methodology which discusses product lifecyde perts in to cope with changing technology need growth curve methods and structures In Section by mabut pull and competitive with hung described Section is about us and discussion and work of sofreclogy for inte Finders and cologies undergo constant change Pally, the conclusion of our stay wired in Sections movement. Technological change is both att and anotury to ente and country very podately issued to life cycle than reduction to decine Investigation of life cycle METHODOLOGY Willips, customers and come for taking This section to the methodowed for Copyright 2016 MECS 1. stormation Engineering and lemons 2016, 1, 11-20 Tetelee Promoting A Come Stay Sate Teedeeders facile poden in the poprowth The option of I Goth Curves Growth creed to follow and when a tech mach Growth Tabelog og A Ce Study of the Textdateis foncting clogspot # Growth Cune Estime the pres of growth curve The Growth curves and to fomcast how and when equation of the growth curve is minded into a technology will machis per limt Growth paim of lines function ang mun logarithen. The os technologies in a particular industry help to understand the industry churcteristics and wyze the permet of Fine model are the estimated using simple linee gron technology in proces. It is applied to a very hi Fird best fit growth model. Men ble detin of the truding technology, physics biology social OMAD) and foot mean we (RMSE science and economic Growth curve essed for used to calculate the fining of methock forcating the mobile we growth 141. diffusion of Mobile Telephony S. 61. Wireless phone diffon und in DRAM Industry (8) MAS = Growth analysis is highly qurative and is numerical data and s-shaped curves. The S-curveis emerged as a mathematical model. There is very mld growth in the number of growth curve methods for MAPE in the development and substinion of CZ technologies. Fou growth curve models from Project the historical data yg best fined growth are described below do Identify the market state of the industry based Lace ( Parve - In this model growth is on the concepts of met structure slow in the eady stage of adoption and becomes faster product demand proaches the solution level. It is therefore appropriate to use the logistic Limitations of methodology: model to predict process of technology diffusion Urpendictable events such as of Incremen version of technology product rewalttive for the L product etc are beyond the scope of this study A Product Life Cycle The Product life-cycle (PLC) concept was first . Gampere The Gomet curve is to the introduced by Joel Dean in 1950. It is product's sales logistic curve, but is point of infection is not proits over its lifetime. Majority of the authors stated sya and it does not plot a ghline the product life cycle can be divided into four stages on a seni logorp These caves are ined to nuely introduction growth, my and decline Echologies where the growth in the According to Kode it involves five distinct syges trital stage is father in the logistic curve mely product development introduction growth maturity and decline 121 reduction in this stage prodat gets launched More Molecule This model describes the progress into the Sales a slow as the product is not of a growth situation in which it is believed to the yet low Emphasis is on advertising and distribution rate of growth my time is proportional to the Tot yet to be achieved The Mono-Molecular Grow This stage shows powry murit model to rection pour More Molecule acceptance and tramasing profits_Competitors model is also called Body equation or begin to the modelect the beness Mitscherlich model concerts on ping product availability Maturity. The nile of sales growth slow down as X-La-copl-60) the product us been widely distributed and sold The company now focuses on creating and edersion and promotion offers to boost sales New Log-logistic The leg-logistication product this critical to ensure future sales anginally proposed by Cole and his cousin Decline Sales dow down dtically and prots 1993 to describe the onlinear the traction fall of the product may be dropped to me way of micro and was modified by Chen for new padicts and the cycle commerce and Hoover in 2003 to avoid the directe of differential numbers and to the number The theoretical moule behind the PLC Concept of purus in the equation from four to the from the theory of diffusion and dean of inwone buffet 12 types of PLC po decovered by neiges (3) Copyright 2016 MECS 1.J. Information there and Blectronic 2016 L. 11-20 bustnes. Duopoly is a special case of an oligopoly ecology. Estimat th two fim. Oligopolies exist in many forms. Volterra model v onopoly / Pure monopoly: There is only one genetic algorithn pplier who has significant market power and and competitive termines the price of its product A pure the market, name onopoly faces little competition because of high OSX and the p miers to entry, such as high initial costs, or Market share cause the company has acquired significant percentages is us arket influence through network effects, for extracted from stance from 2003 to the In [15], the e Table 1. Characteristics of Market Structure. such as Program rac Perfect Monopolisti Oligopoly Monopoly browsers and we tic compet entropy. The end ition competition thermodynamics ber Marty Many Few One With applied in softu ms dominant pure TT. morvopot states that entwp e of Homog Differentiate Differenti Unique/ represent the ma luct d Limited, market sharec No close systems, web bro substitute Relative Relatively Average Large general, these so ly small small Large more diverse ket Small Small Average Highest Paper [16] ire High evolution of sof None Low High High families of soft Nil LOW High High languages, opera ting database mana regression mode collected from th centration ratios provide estimates of the extent to papers, journals, the largest fimms contribute to activity in an Yaofei Chen try. They can be derived using variables such as multivariate eneous ated of Tiers nice wer right 2016 MECS I.J. Information Engineering Market Stutun sales tumo, loyment and maisha The concert is the percentage of medier som Matract to the rare and despre of held by the largest imminentny competition in the made for goods and services. There micro strumpur competition III. RELATED WORK polistic competition, aliyopily, and pure reply 19. 10. 11). Las the structures are often refered to as This section describes the related work in software Imperfect competition structum This section discuss technology forecasting using the projection methods geren concept of met structure from and models Paper [12] deved statistical models tore the Pue conpetition As there are large number of trend and the monship between different factors that fims producing productore super carret chincterize an operating system According to the way ching the mult price Market prices it is possible to predict if an operating system will dened by consumer demand The number of succeed or fail Multivariate multiple regression method buy and sense Independent and large in is used for modeling the evolution of operating Systems number. The products are homogeneous. The best such as Unix, Solaris Sun OS, BSD, Windows, MS-DOS. emples of a puntly competitive market are MAC OS, Linux, Net W. HP UX, GNU Hun SM can products Aix Comp DEC VMS, 05/2. In 1931. evolution of Monopolistic competition Supplies try to achieve different operating systems is evaluated. The trend of 15 some price tages by differentiating their different operating systems have been investigated. The products from other similar products. Most mitate regression model is built as per the problem CORS goods, such as health and beauty ads, fill to investigate the operating system populatty. Their into this category results show the Windows MAC and Linux operating Oligopoly: Made is derived by a few suppliers system will survive the met Windows will lead the Limits the number of time that can into the murat followed by MAC Linux Willow steadily mit An Industry that was a relatively small Spyridoula Lakel 1141 presented the result of number of films that dominate the market is called a desktop laptop operating systems molt evolution using concerned industry. Oligopolies concerned the concepts of population durics and organizational industries Duepoly is a special case of an oligopoly ecology. Estimation and forecasting is done by Lotion with two fim. Oligopolies exist in my forms Vole model whose parameters are estimated by using Monopoly / Pue monopoly: There is only one genetic gori. This paper was the evolutionary supplier who is significant more power and and competitive dyruries of the three ding players of determines the price of its produi. A pure the tunely the OSS Lin the party OSS MAC monopoly faces lle competition because of high OSX and the propriety Windows operating system busto entry, such as high initial costs, or Market share of penting system med in because the compy has acquired significant petersed as indicator for wycion Data mot influence through network effects for instincted from W3Schools log filles during the period Inst from 2003 to the second quarter of 2010 In 15. the evolution of different Software products T. Chce of Mario Strum such as Programming languages operating system web ChuNThalar Mapta oleh May twowers and web servers is woed in concept of entropy, Theertopy function which is widely used in corpion thermodynamics and information theory is used and Tv Ore with applied in software urlat se aralysis. The rest Per states the copy in met verwysis can be to TY Une represent the market diversity. The case studies on the La mult sture of port largas genting No dove systemsweb browser, and web ve showed that in divy gere these software more becoming more and im mare divine Paper 116 presented quitative model of the evolution of sowe technology for different families of some products such a guing LIN language, operating systems, middleware system and wing detabergement Systems Authors proposed repression model for pandicting the data is collected from the web be survey, boole, chical Concerto de provide estimates of the detto papers, journals and other document which the largest fi corbute to activity in an Yaoid Chen et al. [17] rod mus industry. They can be detud ning vales such as multe on mod Copyright 2016 MECS 1. Dyrmation Dyneering and Electrode Bustos 2014. 1. 11-30 d me None Tetement A Cesty of Software Technology oda Familia plage As a consultes before MAC OS. cod 17 high level penting languages such The results obtained to 112) 11. 114 Adi, All, APC, C, Cobol i Fort the forecasted evolution of operating system J ML Moda Pical Prolog Scheme and by applying the Loda Voltem mode. The conclusione Small The result shows the Will be the only we follow Language that's will increasing in popularity is new in market and will affect the Java's future popularity Windows will in the leader in the market with an 81% mashire But it starts are reduced Mac OSX is expected to macha 12% market share IV. RESULTS AND DAUCUSSION Linux has a low growth it, yet it is the one This section results of forecasting of different of the mat. Despite the fact the competition is some technology product families viz, desktop and hard for Linux, i mit seine china mote opening ystems, such agres web browser 7% and co-exists with the two other systems web serves and programming langes Pour growth curve methodsrumly Logistic All of the three data sources are the Microsoft Gomets. Log Logistic and Mono Molecular growth Windows family in the contrat penting system with a we methods are used for foncting Fint sumption modet share of about 90% According met models bhd powth curves is that the upper limit of the ring system minust follows pure monopoly in choy is known. The choice of upper limit is market structure independent of te dice of growth curve. It is difficult Microsoft has adopted metal product to find the upper limit for any technology product Upper development model. Table 2 shows exor mennes of lima talen in this paper ate sufficiently higher values Windows opening system products. then the values perted in historical data Figure 2 shows the forecasted results on art stere for Windows operation systems products using best fitted A Desip Operating Systems growth curve method Out of hundreds of posting systems developed, only Microsoft ended support for Windows 98 and few are very successful. Two penting systems Initially Windows ME from July 11, 2006. Windows 2000 is dorted the personal computer and was unsupported from July 13, 2010, Windows NT is a fully Microsoft MS-DOS and UNIX. Later on there is a series of operating Systems produced by Microsoft, the first of Windows bed and UNIX based operating Systems version of which was sed in July 1993. Figure 2 1131 shows that these Windows operating system product will For Desidop Opening Systems, the dea is enacted be completely out of mult in next three years. The from W3Schools log-bles over an eleven year period quitative forecasting with growth curve shows that Windows XP Willemain in the market till 2006. Butas and on a yeady basis spurning from 2003 to 2013 (18) Time 1 shows the forecasted results for operating Microsoft declared of end of support for Windows XP by systems technologies April 2014 (19). Probably it will vanisher than 10 Windows Vista shows very short product lifecyde. Windows 7 and Windows 8 is gaining popularity in the gobil mudet. All the Windows operating systems products we ot very successful. Windows 98 and Windows XP are compatively has long life cycle tun Windows 2000, Windows ME and Windows Vista - M Alahgs Mini Windows Operating System cand tan of the mediat she be it so be uddy deding in a futum MAC Opening Systemet gidy in met being scord in -has tham The Line Operating system is TWO dowly the MAC OS in der even it come Copyright 2016 MECS 1Jromotion Date and Electronic B 2014. 11-20 TACT 2026. Windows Vista shows very short product life cycle Windows 7 and Windows 8 is gaining popularity in the global market. All the Windows operating systems products are not very successful. Windows 98 and Windows XP are comparatively has long life cycle than Windows 2000, Windows ME and Windows Vista Wind Windows UNUT LINUX MAC MAC 2000 2008010101010 wartet IP dows Fig. 1. Focused Results for Operating Systems Technologies Microsoft Windows Operating System has captured more than 90% of the market share but it seems to be slightly declining in coming future. MAC Operating Systems are growing rapidly in market being second in usage market share. The Linux Operating system is Fig.2. Forecasted Results for Windows Openiting Systere Products growing slowly than MAC OS in market even it came Using Best Fitted Growth Curve Method Copyright 2016 MECS 1.J. Information Engineering and Electronic Business 2016, 1, 11-20 Year Teddy A Cody of Star Toutes 15 For all the per te prodation from the MAC OS X 104 MAC OS X TOS, MAC OS X 10.6 diction of the opening is not available, 50 sened on April 2005 October 2007 and August 2009 diffet to see the life cycle of all the entire respectively, MAC OS X 10.4 and MAC OS X 105 e Figure 2 shows the Windows 7 and Windowed uported MAC OS X 10.8 Mountain Lion e following chilogy life cycle Scurve Best fitted is the home of MAC OS X mened on July curve methods to Windows 7 and Windows 25, 2012 Monomad Gorputz pectively Timothes for Windows Gamta Log La Wissen More Midi MAENSE MAE RMSE MAR RMSE MAE REMSE 0 17.1 112 123 16.5 175 16 1 WP 141369514451705 16 1427 171 100 1.55 IT041471 11:27 18.50 5445 20 214 43 19 496 5127 129 4 Wind 30 120 492 129 5.12 400 5.40 2.30 UR NO 327 5 229 200 161 ON 140 Wird 40 6.00 8.06 20 43 GRO 1.50 100 473 700 424 199 0.00 0.31 000 030 LOS W 0.00 GS 0.00 0.00 0. 030 100 0.00 6.34 000 041 0.00 Tilbefore comigo & Tools Lepot Leggi Man-Meet MAE MSEMALAMSE MAE ILMSE MAE RMSE 0.30 0.75 100 100 0:20 65 0.00 151 Andred se 0.00 100 120227 OST 0:40 7 GO LIS LED 2.54 9.00 0.57 0.00 LH 10 033 be 0.50 1.00 03 20 193 0.30 100 03 09 0.50 OM 30 ON 030 104 0.33 0.95 OM LET 10 1046 10. OS 90 30 188 50 1052 13 100 100 100 . AR 100 RE 40 103 1.00 2.53 2.40 10 10 50 2m 24 2.00 20 34 470 20 154 30 230 195 283 41 133 150 399 207 LON 100 167 25 250 150 Ow 20 1.50 22 180 IT 119 217 Tim 3 shows the focus on the The MAC este products. It shows the MAC OSX 10.4 and 105 will become out of met up 2017. MAC OSX 10.5 107 sw lineup tom MAC OSX 108 follow the life cydes Mari Laptop Opera For Mobile and top Opening Systems, the data were extracted from Nedehur logies over sixpand on a ywdy spring 2008 to 2013 Cat 2016 MECS 1. Iyorition Property and Electronic 2016. 1. 11-20 Todo Ahotos a35685428f15a3a7a32db5b96f2... 2 Tedlogy Tocanting A Cee Study of Setite Technology Pondar Familie Tim 4 slows the focus on muutetture rires Werwer and Lycos leched in 1994. Soon for mobile and top penting systems wing best med a my such engines appeared runely Magellan prowave method Exciterok, rom, Northern Light, and Aluvista Except los ad Android pods are in and Yahoo Ask was a sech engine founded in 1996 by decline pe Macles of iOS is more than 50' and Gume Gummer ind David Warthen in Berkeley show very slow line growth Android is following Califomis Around 2000. Google's search engine rose to mely life cycle Scurve with best tinted model Log prominence Microsoft flest launched MSN Search in the La Near to 2025. And will come more fall of 1998. In 2004. Microsoft started its own web Share this competitors. crawler Microsoft's ned och engine Bing was Launched on June 1, 2009. In the People's Republic of Chin Baichlid a 61.6% market se for webuch in July 2009 For Search Engines, the dit were ected from Miestures log files over a six your period and on a yearly basis, spenning from 2008 to 2013 (20) GE Fonds Me Share for MAC Opening som Prati res Tom Made Shres Best GrowCurve Minhed The results states that the market shie of Google will be declined slowly, AOL, AltaVista, Lycos and Ask web wowe will be out of market in coming years. The mult she of Baldad Bing web we will be Increased in coming you Many search engine companies were caught up in the dit.com but a speculation-driven met boom that pened in 1979 and ended in 2001. Yahoo quind Incond in 2000 and Overture (whichowed Allthe Web for Mond Laptop und AltaVista in 2003. In addominated by Google, in 2009 Yahool and Microsoft announced the interion to fongeanime211 In the year 2001, Sanddeld comforse Even after big mange and use in your 2013 of male and topping System in the southet met strene fodos menopoly because yo 2011, como of OS and acids Goode contains 77.46% of what she which is Bit rot in de polyestre A Wann in total mehet. According to forecasted day is defined as in which the put in the year 2005 m. shores of Google and Bacha will of demand she is wid by two companies. But in be 71.72 and 21 22% spectively. Which indicates that care two companies with market share the machine muren from poly to The muito be died as oligopoly. The olio ply forced shows that her your content shoof OS and And will be very close and D. Web Cinco will be more than it indica the year 2000 Will the form For web the data were ex from wisches log files over a wave your period non ally to carry Yay burgom 2000 to 2013 1) c Search Engines w the focused on sa for web browserbest itted the method Tom Beyner a d ail f such Maria de ter will be out of me Copyto 2016 MECS 1. Born and records 2011 1. 11-30 Testy Face A Che Shaty of Soe Technology com you. The show the measure of Figure 7 shows the forcested results on markets Creet Es will be declined wyply. The for web servers te best fitted growth curve method mdat hoe of Safed and opem will be very slowly The issues that the mediat share of Sun Google med in coming years fox ad Chrome shows und NCSA web server vendors will be declined only upied tend Chrome follows technology life cycles The me shure of Apache, Microsoft and growth curve with best tinted growth curve method, Gorete server vendors will be increased in coming years In the year 1995, NCSA W or player in the met with must Themat she is reduced to 22% and 7% in text two years. In 1996 as there is aligopoly in web ve market 1996 and 1998 apache, sunted NCSA acquired of me stres. Since 1999to 2012 apache and Microsoft.com chigopoly in the year 2013 Apache Microsoft and rin corn 86.00% of mediat shines and their concertion meio is also high so web server follows oligopoly met model F. Programmer Larges For Priming Languages the data were extracted from TIOBES log files over a thirteen year period and on a yearly basis spring from year 2001 to year 2013 123] The TIOBE Programing Community Index is in Indicator of the popularity of programming languages Tan Midot for begle Towne Method In the year 2002. Irtemet Explorer popular web browsers with more than 88% market shee. The malo structure was premeropoly In the year 2018. Chrome 52.32% of market shares which is not enough for monopoly. Concerto mitio of Chrome, Internet Explore and Firefox is maximum le 92.92% It indicates that web bro mula sa follows ligopoly, Focated result shows that incoming a's market dare of Chrome Firefox will dominate the global midt But the search engine markets will remain in oligopoly as the most Chrome and Firefox will be reven Web Server For Web Server verdies, the data wistedmcted from Te on Me Top 10 Larged with Care Netcuts log files over nieteen year period dona youty basispreng from 1995 to 2013 (22) Figure shows the forecasted results on market se for top 10 proming languages wing best find growth curve method The most states that C, C++, Java Visual Bancavage will dette er stare slowly. The more of active C. VB.NET Python PHP larguage will be remoed in coming yee Objective and Vial Basic NET Jhows technology Scurve with Gompert curve and Lot curve respectively. Promen lipuges nely D. Delphi Object Pascal JavaScript Lip MATLAB, Pascal, PL SQL, Ruby. TSOL in but then meseis very rul The used are different remported in 17. The time frame of relation and methods in this paper is de fim (17 According to tal values of ging large in Water yer C, C++, Villachad 6.0 of in Me muddates which shows that the weapolit Copyedi 2016 MECS 17. Information Eryri and Electronic Run 2016, 1, 11-20 Testy A Chiar ch IN Technology Foutre A Cine Study of Safe Technology Prodat Fardles competition in mediet. In actual mult sees in your indicates the programming language muset follows pa 2015 and forecasted me shes to your 2025 competition TeowthCunetor Game Ladde ww Lex tha| Mone Mac MAE RMSE MAE ENSE MAE MESE 257 4 54 10 512 Chine 100 3.71 1225 S5 04 0 705 10 EMSE ME NO 7.17 SIR 5 100 79 69 09 RO RO 20 5.56 567 ST R15 ROS BOS 7.15 30 10 451 20 7 100 20 30 re 14 11 195 16 214 107 125 108 14 14 14 02 256 26 M 25 25 25 1 16 16 04 04 15 14 14 13 06 06 10 09 10 04 115 0.33 0 23 o O Open 30 3 10 20 10 0 0 0 0 009 32 034 04 0.33 0 0 0 02 00 LAT 00 0 0 0 0 3 03 O 0 Web Van MAE Mome MAE EMSE 100 1177 Anche SHILI 0.75 . M 49 Table PowerGrowCurves for Web Upper in Go Lech Legile MAR RMTE MAE UNSE RMS 11. 844 11.50 7.00 RO 9.16 1167 758 09 100 RS 2.37 ILM 10 OM 0.71 11 072 20 0.71 137 0.71 1 0.71 141 30 071 0.21 13 071 16 40 456 40 66 40 55 407 00 50 OS 6.64 20 166 0 021 0 TS 1 1 30 097 05 0.90 0.17 D 05 1.1 0 090 50 . 0.96 ON 11 . 1.74 154 23 1. 0 OURS BU 1.7 41 LI 23 118 3 1:07 116 64 NCIA lalalal 09 07 De ta Copyright 2016 MECS 4. Hormation Enter Electronie 2016 11-20 Thom A Cee Study of Soft Tectele de ses V. CONCLUSIONS AND FUTURE WORK This paper forecasted the growth of softwe orchlogy predicts using growth curve methock Different products follow different growth curve putem The limition is with products with less dat it causes similar perfumes of all the growth curve methods and nility of identification of upper limit for the products Table 6 shows the little change in mat structure for selected technologies in next 10 years. The mu strict of software technologies indicates that one or two providers have mujor murot share programming languages. The forecasted market structure shows that the much of respective technology dominated by one or two technology providers. A reason behind the monopoly or oligopoly market structure is high technological superiority of one provider with con technological improvement over potential competitions. The results show the more technology providers in their med space such as Java ME (Mobile and Tablet Operating System Internet Explom (web browser, NCSA (web servers are will be out of the market due to high competition og behind the technological advances The Marie Te Maanagar 200 Mony ROERENCES CV. THY. WE Anion of the time varying steeds and Compet models for forcing short modt lifecydes Add Endring i 22.01-00 121 P. Kode Ang Principles of Maling on Education 2010 D. Rink. IL Swert Product life cycle A Tom of business och 7 11979,219-24 14 Tin T Rehong curve model for mobile thered the Poding of the ICENT 10, 51-60, 2010 151 XLTS WE W. L. Chi Diffusion of mobile gheny in Chene divers and forces. IEEE Tanong Mat 592) (2012) 299 300 AWL Ch.S. WE KS. K.C. Yan Dision of mobile phone Anal stay in The Telecommunion Policy, 2009, 506-520 1 RIKA A Teorom. The global diffusion pes of cove technology tone modeling malog and detail wire prone w Pred the proceedings of the ICT-270 2006 TRI RYY W Dong Y H Chu F M Trek Como dion model Acety on the DRAM y Preted at the Poording of the PUZZLES 120.1-7.2012 191 D D N D K M. competition and more 1101A L Silvia Chuo chat die de and Competition Anwy Porte Faculdade de comme do Porto Universidade do Porto 2001 11 Mola Antion of today forever Corries of Global Mare 43 20081214220 112 Y PELA ML Model the won of opertine Anwil study. Journal of Systems and Softw. 01.2007, 1-15 1131 Yang Chuncertain the worn of opening PhDdon New Jersey de Tedy, 2005 154 S. LC Mic DVD. Mart Coupe dyruics in the med Modeling and policy. Technical Forecasting and Social Change 001 200-10 115 L YUS. R. B. LA Crematies of we want to Pored the proceeding of the Amal Conference on Applied Research in Iron Techly. pp.3791, 2009 DALILAR Y Z A MLA for so eine in some 1R1 (T-009 1171 Y. Cher I. Dios. A. Mill L. WE WA tudy of my laput 22.00 2015. 73- TER/WWWchools.com Ad Now 2014 idom.com Mondo Mar 2015 20 W.com AN 2014 2) T. S og Korth Present Proceedings of the US VEL. 2. 2011 Sy Oply ht Mon CHOOL Mency Oppily With Dy Oly Oply La 2001 P pa|pana Gwh putem of high technology software product is Intenced by the mat structure. The technology product farly in the monopoly or oligopoly does not at the presence of shaped life cycle pale. Many product flies following / decres life cycle putem All the technology product providers follow increment product development. The product failies show incing life cycle potem probability follow scioped pe or trovative malty for Individu incel products. Tew products such as Windows 7, Windows MAC OS X 10.8 and Chrome web show with similar "S" shaped Tuture wode estudion of life cycle of softwa chodes with complete data of all products. Also there is scope te vestigde the influence of contact factors on me data of sochy Copyright 2016 MECS Bryumurton hormon lectronics 2016. 1. 11-20 Table 6. Results of Market Structure (Year) Year 2013 Year 2025 Monopoly Monopoly Software Product Technologies Desktop operating System Mobile & Laptop operating System Search Engine Oligopoly Oligopoly Monopoly Oligopoly Monopoly (2008) Oligopoly (2009) Monopoly (2008) Monopoly (2002) Oligopoly (1995) Oligopoly (2001) Web Browser Oligopoly Duopoly Web Server Oligopoly Oligopoly Programming Language Pure Pure competition competition TOOLS AND TECHNIQUES OF TF THE AVAILABLE TECHNIQUES OF TECHNOLOGICAL FORECASTING CAN BE CONVENIENTLY CLASSIFIED INTO FOUR GROUPS: INTUITIVE MODELS - DELPHI ,CROSS-IMPACT ANALYSIS, MONITORING TREND EXTRAPOLATION MODELS - TREND CURVE, ANALOGY (HISTORICAL AND GROWTH) TREND CORRELATION AND IMPACT STRUCTURAL MODELS - RELEVANCE TREE, MORPHOLOGICAL ANALYSIS HOLISTIC MODELS - STOCHASTIC NETWORK, ENVELOPE CURVE and an opportunity product / technology is subjected to life cycle staring from introduction to decline Investigation of life cycle 11. METHODOLOGY will help enterprises, customers and country for taking This section introduces the methodology used for Copyright 2016 MECS 1.J. Information Engineering and Electronic Business 2016, 1, 11-20 12 Technology Forecasting: A Case Study of Software Technology Prochet Farriles forecasting software technology products. B. Growth Curves a) Estimate the parameters of growth curve. The technology will reach its upper lirit. Growth patter of Growth curves are used to forecast how and when a linear function using natural logarithms. The various technologies in a particular industry help to parameters of linear model are then estimated using technology innovation process. It is applied to a variety simple linear regression b) Find best fit growth model. Mean absolute deviation of fields including technology, physics, biology, social (MAD) and root mean square enor (RMSE) are science and economics. Growth curves are used for used to calculate the fitting of methods. forecasting the mobile tser growth [4), diffusion of Mobile Telephony [5, 6), wireless phone diffusion 171. SN trend in DRAM industry (8) etc. Growth analysis is highly quantitative and requires M (1) numerical data and uses S-shaped curves. The S-curve is emerged as a mathematical model. There is very rapid growth in the number of growth curve methods for NAPE examining the development and substitution of N (2) technologies. Four growth curve models from literature are described below. Project the historical data using best fitted growth curve method d) Identify the market structure of the industry based Logistic (Pearl curve) - In this model, growth is slow in the early stage of adoption and becomes on the concepts of market structure. faster as product demand approaches the saturation level. It is therefore appropriate to use the logistic model to predict process of technology diffusion MAE = 2*11. SN Technology Forecasting: A Case Study of Software Technology Product Families Amal C. Adathe, Ahhursinh V. Surve Raportin e of Technology, and MS India Erwin the mil.com Gopalomaran T. Thumpi Dept. of IT. TSEC, Bach, Mattel, MS, India E-mahoo.com Aht With Image of computers, ir decision about the policies optional activities and Communication technologie some of investment plans etc. Product life cycle is a tool to help technologies pats become part of weryday life. on to form the competition in Many reports shows the use of desilop and mobile the PLC Concept ested to different aplication on system with mines web browser, web as such as com diven les phim we w programming languages are sing podstrology products Industrial products Tipidly. This paper focuses on foncting them the most common product life cycle punem is the of selected software technology product families ning classical, bell-shaped, but it is not the sole se det store as indicator Resis of four growth curve Technology forecasting predicts technological method wy Logistic Gompertz, Log Logistic and trends such as the direction and the rate of technological More Molecular e compared wing MAD and RMSE development. The primary function of forecasting is to For the period under consideration predict the future using a welove in and More mujority software product files following 100 methods of ecology forcasting developed and decin growth potem Restits indicate that incestry applied by others. Growth aralysis is highly aspetive technology product in dominated by quantitative and quas numerical data and few provides for your 2005. Monopoly or oligopoly shaped curves. In liten growth ces are often used et structure will lead to log incing period for for modeling product lifecycle Growth curves (the fint the top provide derivative of the product lidecycle curve are widely used in technology forecasting 11 Ini Terme-Software technology products Product This paper focuses on forecasting life cycle of selected life cycle Growth curves. Miesto software technology product families growth curve methods. In this paper we have focused on different software colores vides top and mobile L INTRODUCTION penting such engines webwe, web Technologies tuve a significant impact on all aspects ve and the software of life. The global society and economy is undergoing a products are shows OS me of fundamental nometion because of advances in incremental products. The indicatored for forecasting egies. Today's marketplace is highly influenced is the market shurd in peceta Four by domowdogical che, dobilisation Logistic (Pea Rot, Gompert. Locistic and More methods of growth curves an experimente me and increased use of software technologies. Today's one facing the tales competition Molecul. The obtivo dentify the met structure of the selected are technology arduracions should strive to customs by Outperforming their competitors Softwa chrology product families petit compare also fading this problem The rest of the personas follows Section 2 Compresory need to improve their sofie is about methodology which discusses product lifecyde perts in to cope with changing technology need growth curve methods and structures In Section by mabut pull and competitive with hung described Section is about us and discussion and work of sofreclogy for inte Finders and cologies undergo constant change Pally, the conclusion of our stay wired in Sections movement. Technological change is both att and anotury to ente and country very podately issued to life cycle than reduction to decine Investigation of life cycle METHODOLOGY Willips, customers and come for taking This section to the methodowed for Copyright 2016 MECS 1. stormation Engineering and lemons 2016, 1, 11-20 Tetelee Promoting A Come Stay Sate Teedeeders facile poden in the poprowth The option of I Goth Curves Growth creed to follow and when a tech mach Growth Tabelog og A Ce Study of the Textdateis foncting clogspot # Growth Cune Estime the pres of growth curve The Growth curves and to fomcast how and when equation of the growth curve is minded into a technology will machis per limt Growth paim of lines function ang mun logarithen. The os technologies in a particular industry help to understand the industry churcteristics and wyze the permet of Fine model are the estimated using simple linee gron technology in proces. It is applied to a very hi Fird best fit growth model. Men ble detin of the truding technology, physics biology social OMAD) and foot mean we (RMSE science and economic Growth curve essed for used to calculate the fining of methock forcating the mobile we growth 141. diffusion of Mobile Telephony S. 61. Wireless phone diffon und in DRAM Industry (8) MAS = Growth analysis is highly qurative and is numerical data and s-shaped curves. The S-curveis emerged as a mathematical model. There is very mld growth in the number of growth curve methods for MAPE in the development and substinion of CZ technologies. Fou growth curve models from Project the historical data yg best fined growth are described below do Identify the market state of the industry based Lace ( Parve - In this model growth is on the concepts of met structure slow in the eady stage of adoption and becomes faster product demand proaches the solution level. It is therefore appropriate to use the logistic Limitations of methodology: model to predict process of technology diffusion Urpendictable events such as of Incremen version of technology product rewalttive for the L product etc are beyond the scope of this study A Product Life Cycle The Product life-cycle (PLC) concept was first . Gampere The Gomet curve is to the introduced by Joel Dean in 1950. It is product's sales logistic curve, but is point of infection is not proits over its lifetime. Majority of the authors stated sya and it does not plot a ghline the product life cycle can be divided into four stages on a seni logorp These caves are ined to nuely introduction growth, my and decline Echologies where the growth in the According to Kode it involves five distinct syges trital stage is father in the logistic curve mely product development introduction growth maturity and decline 121 reduction in this stage prodat gets launched More Molecule This model describes the progress into the Sales a slow as the product is not of a growth situation in which it is believed to the yet low Emphasis is on advertising and distribution rate of growth my time is proportional to the Tot yet to be achieved The Mono-Molecular Grow This stage shows powry murit model to rection pour More Molecule acceptance and tramasing profits_Competitors model is also called Body equation or begin to the modelect the beness Mitscherlich model concerts on ping product availability Maturity. The nile of sales growth slow down as X-La-copl-60) the product us been widely distributed and sold The company now focuses on creating and edersion and promotion offers to boost sales New Log-logistic The leg-logistication product this critical to ensure future sales anginally proposed by Cole and his cousin Decline Sales dow down dtically and prots 1993 to describe the onlinear the traction fall of the product may be dropped to me way of micro and was modified by Chen for new padicts and the cycle commerce and Hoover in 2003 to avoid the directe of differential numbers and to the number The theoretical moule behind the PLC Concept of purus in the equation from four to the from the theory of diffusion and dean of inwone buffet 12 types of PLC po decovered by neiges (3) Copyright 2016 MECS 1.J. Information there and Blectronic 2016 L. 11-20 bustnes. Duopoly is a special case of an oligopoly ecology. Estimat th two fim. Oligopolies exist in many forms. Volterra model v onopoly / Pure monopoly: There is only one genetic algorithn pplier who has significant market power and and competitive termines the price of its product A pure the market, name onopoly faces little competition because of high OSX and the p miers to entry, such as high initial costs, or Market share cause the company has acquired significant percentages is us arket influence through network effects, for extracted from stance from 2003 to the In [15], the e Table 1. Characteristics of Market Structure. such as Program rac Perfect Monopolisti Oligopoly Monopoly browsers and we tic compet entropy. The end ition competition thermodynamics ber Marty Many Few One With applied in softu ms dominant pure TT. morvopot states that entwp e of Homog Differentiate Differenti Unique/ represent the ma luct d Limited, market sharec No close systems, web bro substitute Relative Relatively Average Large general, these so ly small small Large more diverse ket Small Small Average Highest Paper [16] ire High evolution of sof None Low High High families of soft Nil LOW High High languages, opera ting database mana regression mode collected from th centration ratios provide estimates of the extent to papers, journals, the largest fimms contribute to activity in an Yaofei Chen try. They can be derived using variables such as multivariate eneous ated of Tiers nice wer right 2016 MECS I.J. Information Engineering Market Stutun sales tumo, loyment and maisha The concert is the percentage of medier som Matract to the rare and despre of held by the largest imminentny competition in the made for goods and services. There micro strumpur competition III. RELATED WORK polistic competition, aliyopily, and pure reply 19. 10. 11). Las the structures are often refered to as This section describes the related work in software Imperfect competition structum This section discuss technology forecasting using the projection methods geren concept of met structure from and models Paper [12] deved statistical models tore the Pue conpetition As there are large number of trend and the monship between different factors that fims producing productore super carret chincterize an operating system According to the way ching the mult price Market prices it is possible to predict if an operating system will dened by consumer demand The number of succeed or fail Multivariate multiple regression method buy and sense Independent and large in is used for modeling the evolution of operating Systems number. The products are homogeneous. The best such as Unix, Solaris Sun OS, BSD, Windows, MS-DOS. emples of a puntly competitive market are MAC OS, Linux, Net W. HP UX, GNU Hun SM can products Aix Comp DEC VMS, 05/2. In 1931. evolution of Monopolistic competition Supplies try to achieve different operating systems is evaluated. The trend of 15 some price tages by differentiating their different operating systems have been investigated. The products from other similar products. Most mitate regression model is built as per the problem CORS goods, such as health and beauty ads, fill to investigate the operating system populatty. Their into this category results show the Windows MAC and Linux operating Oligopoly: Made is derived by a few suppliers system will survive the met Windows will lead the Limits the number of time that can into the murat followed by MAC Linux Willow steadily mit An Industry that was a relatively small Spyridoula Lakel 1141 presented the result of number of films that dominate the market is called a desktop laptop operating systems molt evolution using concerned industry. Oligopolies concerned the concepts of population durics and organizational industries Duepoly is a special case of an oligopoly ecology. Estimation and forecasting is done by Lotion with two fim. Oligopolies exist in my forms Vole model whose parameters are estimated by using Monopoly / Pue monopoly: There is only one genetic gori. This paper was the evolutionary supplier who is significant more power and and competitive dyruries of the three ding players of determines the price of its produi. A pure the tunely the OSS Lin the party OSS MAC monopoly faces lle competition because of high OSX and the propriety Windows operating system busto entry, such as high initial costs, or Market share of penting system med in because the compy has acquired significant petersed as indicator for wycion Data mot influence through network effects for instincted from W3Schools log filles during the period Inst from 2003 to the second quarter of 2010 In 15. the evolution of different Software products T. Chce of Mario Strum such as Programming languages operating system web ChuNThalar Mapta oleh May twowers and web servers is woed in concept of entropy, Theertopy function which is widely used in corpion thermodynamics and information theory is used and Tv Ore with applied in software urlat se aralysis. The rest Per states the copy in met verwysis can be to TY Une represent the market diversity. The case studies on the La mult sture of port largas genting No dove systemsweb browser, and web ve showed that in divy gere these software more becoming more and im mare divine Paper 116 presented quitative model of the evolution of sowe technology for different families of some products such a guing LIN language, operating systems, middleware system and wing detabergement Systems Authors proposed repression model for pandicting the data is collected from the web be survey, boole, chical Concerto de provide estimates of the detto papers, journals and other document which the largest fi corbute to activity in an Yaoid Chen et al. [17] rod mus industry. They can be detud ning vales such as multe on mod Copyright 2016 MECS 1. Dyrmation Dyneering and Electrode Bustos 2014. 1. 11-30 d me None Tetement A Cesty of Software Technology oda Familia plage As a consultes before MAC OS. cod 17 high level penting languages such The results obtained to 112) 11. 114 Adi, All, APC, C, Cobol i Fort the forecasted evolution of operating system J ML Moda Pical Prolog Scheme and by applying the Loda Voltem mode. The conclusione Small The result shows the Will be the only we follow Language that's will increasing in popularity is new in market and will affect the Java's future popularity Windows will in the leader in the market with an 81% mashire But it starts are reduced Mac OSX is expected to macha 12% market share IV. RESULTS AND DAUCUSSION Linux has a low growth it, yet it is the one This section results of forecasting of different of the mat. Despite the fact the competition is some technology product families viz, desktop and hard for Linux, i mit seine china mote opening ystems, such agres web browser 7% and co-exists with the two other systems web serves and programming langes Pour growth curve methodsrumly Logistic All of the three data sources are the Microsoft Gomets. Log Logistic and Mono Molecular growth Windows family in the contrat penting system with a we methods are used for foncting Fint sumption modet share of about 90% According met models bhd powth curves is that the upper limit of the ring system minust follows pure monopoly in choy is known. The choice of upper limit is market structure independent of te dice of growth curve. It is difficult Microsoft has adopted metal product to find the upper limit for any technology product Upper development model. Table 2 shows exor mennes of lima talen in this paper ate sufficiently higher values Windows opening system products. then the values perted in historical data Figure 2 shows the forecasted results on art stere for Windows operation systems products using best fitted A Desip Operating Systems growth curve method Out of hundreds of posting systems developed, only Microsoft ended support for Windows 98 and few are very successful. Two penting systems Initially Windows ME from July 11, 2006. Windows 2000 is dorted the personal computer and was unsupported from July 13, 2010, Windows NT is a fully Microsoft MS-DOS and UNIX. Later on there is a series of operating Systems produced by Microsoft, the first of Windows bed and UNIX based operating Systems version of which was sed in July 1993. Figure 2 1131 shows that these Windows operating system product will For Desidop Opening Systems, the dea is enacted be completely out of mult in next three years. The from W3Schools log-bles over an eleven year period quitative forecasting with growth curve shows that Windows XP Willemain in the market till 2006. Butas and on a yeady basis spurning from 2003 to 2013 (18) Time 1 shows the forecasted results for operating Microsoft declared of end of support for Windows XP by systems technologies April 2014 (19). Probably it will vanisher than 10 Windows Vista shows very short product lifecyde. Windows 7 and Windows 8 is gaining popularity in the gobil mudet. All the Windows operating systems products we ot very successful. Windows 98 and Windows XP are compatively has long life cycle tun Windows 2000, Windows ME and Windows Vista - M Alahgs Mini Windows Operating System cand tan of the mediat she be it so be uddy deding in a futum MAC Opening Systemet gidy in met being scord in -has tham The Line Operating system is TWO dowly the MAC OS in der even it come Copyright 2016 MECS 1Jromotion Date and Electronic B 2014. 11-20 TACT 2026. Windows Vista shows very short product life cycle Windows 7 and Windows 8 is gaining popularity in the global market. All the Windows operating systems products are not very successful. Windows 98 and Windows XP are comparatively has long life cycle than Windows 2000, Windows ME and Windows Vista Wind Windows UNUT LINUX MAC MAC 2000 2008010101010 wartet IP dows Fig. 1. Focused Results for Operating Systems Technologies Microsoft Windows Operating System has captured more than 90% of the market share but it seems to be slightly declining in coming future. MAC Operating Systems are growing rapidly in market being second in usage market share. The Linux Operating system is Fig.2. Forecasted Results for Windows Openiting Systere Products growing slowly than MAC OS in market even it came Using Best Fitted Growth Curve Method Copyright 2016 MECS 1.J. Information Engineering and Electronic Business 2016, 1, 11-20 Year Teddy A Cody of Star Toutes 15 For all the per te prodation from the MAC OS X 104 MAC OS X TOS, MAC OS X 10.6 diction of the opening is not available, 50 sened on April 2005 October 2007 and August 2009 diffet to see the life cycle of all the entire respectively, MAC OS X 10.4 and MAC OS X 105 e Figure 2 shows the Windows 7 and Windowed uported MAC OS X 10.8 Mountain Lion e following chilogy life cycle Scurve Best fitted is the home of MAC OS X mened on July curve methods to Windows 7 and Windows 25, 2012 Monomad Gorputz pectively Timothes for Windows Gamta Log La Wissen More Midi MAENSE MAE RMSE MAR RMSE MAE REMSE 0 17.1 112 123 16.5 175 16 1 WP 141369514451705 16 1427 171 100 1.55 IT041471 11:27 18.50 5445 20 214 43 19 496 5127 129 4 Wind 30 120 492 129 5.12 400 5.40 2.30 UR NO 327 5 229 200 161 ON 140 Wird 40 6.00 8.06 20 43 GRO 1.50 100 473 700 424 199 0.00 0.31 000 030 LOS W 0.00 GS 0.00 0.00 0. 030 100 0.00 6.34 000 041 0.00 Tilbefore comigo & Tools Lepot Leggi Man-Meet MAE MSEMALAMSE MAE ILMSE MAE RMSE 0.30 0.75 100 100 0:20 65 0.00 151 Andred se 0.00 100 120227 OST 0:40 7 GO LIS LED 2.54 9.00 0.57 0.00 LH 10 033 be 0.50 1.00 03 20 193 0.30 100 03 09 0.50 OM 30 ON 030 104 0.33 0.95 OM LET 10 1046 10. OS 90 30 188 50 1052 13 100 100 100 . AR 100 RE 40 103 1.00 2.53 2.40 10 10 50 2m 24 2.00 20 34 470 20 154 30 230 195 283 41 133 150 399 207 LON 100 167 25 250 150 Ow 20 1.50 22 180 IT 119 217 Tim 3 shows the focus on the The MAC este products. It shows the MAC OSX 10.4 and 105 will become out of met up 2017. MAC OSX 10.5 107 sw lineup tom MAC OSX 108 follow the life cydes Mari Laptop Opera For Mobile and top Opening Systems, the data were extracted from Nedehur logies over sixpand on a ywdy spring 2008 to 2013 Cat 2016 MECS 1. Iyorition Property and Electronic 2016. 1. 11-20 Todo Ahotos a35685428f15a3a7a32db5b96f2... 2 Tedlogy Tocanting A Cee Study of Setite Technology Pondar Familie Tim 4 slows the focus on muutetture rires Werwer and Lycos leched in 1994. Soon for mobile and top penting systems wing best med a my such engines appeared runely Magellan prowave method Exciterok, rom, Northern Light, and Aluvista Except los ad Android pods are in and Yahoo Ask was a sech engine founded in 1996 by decline pe Macles of iOS is more than 50' and Gume Gummer ind David Warthen in Berkeley show very slow line growth Android is following Califomis Around 2000. Google's search engine rose to mely life cycle Scurve with best tinted model Log prominence Microsoft flest launched MSN Search in the La Near to 2025. And will come more fall of 1998. In 2004. Microsoft started its own web Share this competitors. crawler Microsoft's ned och engine Bing was Launched on June 1, 2009. In the People's Republic of Chin Baichlid a 61.6% market se for webuch in July 2009 For Search Engines, the dit were ected from Miestures log files over a six your period and on a yearly basis, spenning from 2008 to 2013 (20) GE Fonds Me Share for MAC Opening som Prati res Tom Made Shres Best GrowCurve Minhed The results states that the market shie of Google will be declined slowly, AOL, AltaVista, Lycos and Ask web wowe will be out of market in coming years. The mult she of Baldad Bing web we will be Increased in coming you Many search engine companies were caught up in the dit.com but a speculation-driven met boom that pened in 1979 and ended in 2001. Yahoo quind Incond in 2000 and Overture (whichowed Allthe Web for Mond Laptop und AltaVista in 2003. In addominated by Google, in 2009 Yahool and Microsoft announced the interion to fongeanime211 In the year 2001, Sanddeld comforse Even after big mange and use in your 2013 of male and topping System in the southet met strene fodos menopoly because yo 2011, como of OS and acids Goode contains 77.46% of what she which is Bit rot in de polyestre A Wann in total mehet. According to forecasted day is defined as in which the put in the year 2005 m. shores of Google and Bacha will of demand she is wid by two companies. But in be 71.72 and 21 22% spectively. Which indicates that care two companies with market share the machine muren from poly to The muito be died as oligopoly. The olio ply forced shows that her your content shoof OS and And will be very close and D. Web Cinco will be more than it indica the year 2000 Will the form For web the data were ex from wisches log files over a wave your period non ally to carry Yay burgom 2000 to 2013 1) c Search Engines w the focused on sa for web browserbest itted the method Tom Beyner a d ail f such Maria de ter will be out of me Copyto 2016 MECS 1. Born and records 2011 1. 11-30 Testy Face A Che Shaty of Soe Technology com you. The show the measure of Figure 7 shows the forcested results on markets Creet Es will be declined wyply. The for web servers te best fitted growth curve method mdat hoe of Safed and opem will be very slowly The issues that the mediat share of Sun Google med in coming years fox ad Chrome shows und NCSA web server vendors will be declined only upied tend Chrome follows technology life cycles The me shure of Apache, Microsoft and growth curve with best tinted growth curve method, Gorete server vendors will be increased in coming years In the year 1995, NCSA W or player in the met with must Themat she is reduced to 22% and 7% in text two years. In 1996 as there is aligopoly in web ve market 1996 and 1998 apache, sunted NCSA acquired of me stres. Since 1999to 2012 apache and Microsoft.com chigopoly in the year 2013 Apache Microsoft and rin corn 86.00% of mediat shines and their concertion meio is also high so web server follows oligopoly met model F. Programmer Larges For Priming Languages the data were extracted from TIOBES log files over a thirteen year period and on a yearly basis spring from year 2001 to year 2013 123] The TIOBE Programing Community Index is in Indicator of the popularity of programming languages Tan Midot for begle Towne Method In the year 2002. Irtemet Explorer popular web browsers with more than 88% market shee. The malo structure was premeropoly In the year 2018. Chrome 52.32% of market shares which is not enough for monopoly. Concerto mitio of Chrome, Internet Explore and Firefox is maximum le 92.92% It indicates that web bro mula sa follows ligopoly, Focated result shows that incoming a's market dare of Chrome Firefox will dominate the global midt But the search engine markets will remain in oligopoly as the most Chrome and Firefox will be reven Web Server For Web Server verdies, the data wistedmcted from Te on Me Top 10 Larged with Care Netcuts log files over nieteen year period dona youty basispreng from 1995 to 2013 (22) Figure shows the forecasted results on market se for top 10 proming languages wing best find growth curve method The most states that C, C++, Java Visual Bancavage will dette er stare slowly. The more of active C. VB.NET Python PHP larguage will be remoed in coming yee Objective and Vial Basic NET Jhows technology Scurve with Gompert curve and Lot curve respectively. Promen lipuges nely D. Delphi Object Pascal JavaScript Lip MATLAB, Pascal, PL SQL, Ruby. TSOL in but then meseis very rul The used are different remported in 17. The time frame of relation and methods in this paper is de fim (17 According to tal values of ging large in Water yer C, C++, Villachad 6.0 of in Me muddates which shows that the weapolit Copyedi 2016 MECS 17. Information Eryri and Electronic Run 2016, 1, 11-20 Testy A Chiar ch IN Technology Foutre A Cine Study of Safe Technology Prodat Fardles competition in mediet. In actual mult sees in your indicates the programming language muset follows pa 2015 and forecasted me shes to your 2025 competition TeowthCunetor Game Ladde ww Lex tha| Mone Mac MAE RMSE MAE ENSE MAE MESE 257 4 54 10 512 Chine 100 3.71 1225 S5 04 0 705 10 EMSE ME NO 7.17 SIR 5 100 79 69 09 RO RO 20 5.56 567 ST R15 ROS BOS 7.15 30 10 451 20 7 100 20 30 re 14 11 195 16 214 107 125 108 14 14 14 02 256 26 M 25 25 25 1 16 16 04 04 15 14 14 13 06 06 10 09 10 04 115 0.33 0 23 o O Open 30 3 10 20 10 0 0 0 0 009 32 034 04 0.33 0 0 0 02 00 LAT 00 0 0 0 0 3 03 O 0 Web Van MAE Mome MAE EMSE 100 1177 Anche SHILI 0.75 . M 49 Table PowerGrowCurves for Web Upper in Go Lech Legile MAR RMTE MAE UNSE RMS 11. 844 11.50 7.00 RO 9.16 1167 758 09 100 RS 2.37 ILM 10 OM 0.71 11 072 20 0.71 137 0.71 1 0.71 141 30 071 0.21 13 071 16 40 456 40 66 40 55 407 00 50 OS 6.64 20 166 0 021 0 TS 1 1 30 097 05 0.90 0.17 D 05 1.1 0 090 50 . 0.96 ON 11 . 1.74 154 23 1. 0 OURS BU 1.7 41 LI 23 118 3 1:07 116 64 NCIA lalalal 09 07 De ta Copyright 2016 MECS 4. Hormation Enter Electronie 2016 11-20 Thom A Cee Study of Soft Tectele de ses V. CONCLUSIONS AND FUTURE WORK This paper forecasted the growth of softwe orchlogy predicts using growth curve methock Different products follow different growth curve putem The limition is with products with less dat it causes similar perfumes of all the growth curve methods and nility of identification of upper limit for the products Table 6 shows the little change in mat structure for selected technologies in next 10 years. The mu strict of software technologies indicates that one or two providers have mujor murot share programming languages. The forecasted market structure shows that the much of respective technology dominated by one or two technology providers. A reason behind the monopoly or oligopoly market structure is high technological superiority of one provider with con technological improvement over potential competitions. The results show the more technology providers in their med space such as Java ME (Mobile and Tablet Operating System Internet Explom (web browser, NCSA (web servers are will be out of the market due to high competition og behind the technological advances The Marie Te Maanagar 200 Mony ROERENCES CV. THY. WE Anion of the time varying steeds and Compet models for forcing short modt lifecydes Add Endring i 22.01-00 121 P. Kode Ang Principles of Maling on Education 2010 D. Rink. IL Swert Product life cycle A Tom of business och 7 11979,219-24 14 Tin T Rehong curve model for mobile thered the Poding of the ICENT 10, 51-60, 2010 151 XLTS WE W. L. Chi Diffusion of mobile gheny in Chene divers and forces. IEEE Tanong Mat 592) (2012) 299 300 AWL Ch.S. WE KS. K.C. Yan Dision of mobile phone Anal stay in The Telecommunion Policy, 2009, 506-520 1 RIKA A Teorom. The global diffusion pes of cove technology tone modeling malog and detail wire prone w Pred the proceedings of the ICT-270 2006 TRI RYY W Dong Y H Chu F M Trek Como dion model Acety on the DRAM y Preted at the Poording of the PUZZLES 120.1-7.2012 191 D D N D K M. competition and more 1101A L Silvia Chuo chat die de and Competition Anwy Porte Faculdade de comme do Porto Universidade do Porto 2001 11 Mola Antion of today forever Corries of Global Mare 43 20081214220 112 Y PELA ML Model the won of opertine Anwil study. Journal of Systems and Softw. 01.2007, 1-15 1131 Yang Chuncertain the worn of opening PhDdon New Jersey de Tedy, 2005 154 S. LC Mic DVD. Mart Coupe dyruics in the med Modeling and policy. Technical Forecasting and Social Change 001 200-10 115 L YUS. R. B. LA Crematies of we want to Pored the proceeding of the Amal Conference on Applied Research in Iron Techly. pp.3791, 2009 DALILAR Y Z A MLA for so eine in some 1R1 (T
Step by Step Solution
There are 3 Steps involved in it
1 Expert Approved Answer
Step: 1 Unlock

Question Has Been Solved by an Expert!
Get step-by-step solutions from verified subject matter experts
Step: 2 Unlock
Step: 3 Unlock