Answered step by step
Verified Expert Solution
Question
1 Approved Answer
Temp Cp 2.50E+02 5.25E+01 2.56E+02 5.14E+01 2.63E+02 5.16E+01 2.69E+02 5.37E+01 2.75E+02 5.10E+01 2.81E+02 5.47E+01 2.88E+02 5.47E+01 2.94E+02 5.65E+01 3.00E+02 5.35E+01 3.06E+02 5.61E+01 3.13E+02 5.42E+01 3.19E+02

| Temp | Cp |
| 2.50E+02 | 5.25E+01 |
| 2.56E+02 | 5.14E+01 |
| 2.63E+02 | 5.16E+01 |
| 2.69E+02 | 5.37E+01 |
| 2.75E+02 | 5.10E+01 |
| 2.81E+02 | 5.47E+01 |
| 2.88E+02 | 5.47E+01 |
| 2.94E+02 | 5.65E+01 |
| 3.00E+02 | 5.35E+01 |
| 3.06E+02 | 5.61E+01 |
| 3.13E+02 | 5.42E+01 |
| 3.19E+02 | 5.86E+01 |
| 3.25E+02 | 5.73E+01 |
| 3.31E+02 | 5.53E+01 |
| 3.38E+02 | 5.99E+01 |
| 3.44E+02 | 6.03E+01 |
| 3.50E+02 | 5.67E+01 |
| 3.56E+02 | 5.80E+01 |
| 3.63E+02 | 5.87E+01 |
| 3.69E+02 | 6.25E+01 |
| 3.75E+02 | 5.98E+01 |
| 3.81E+02 | 6.25E+01 |
| 3.88E+02 | 6.29E+01 |
| 3.94E+02 | 6.25E+01 |
| 4.00E+02 | 6.09E+01 |
the list of numbers is the RussianCp.csv from excel
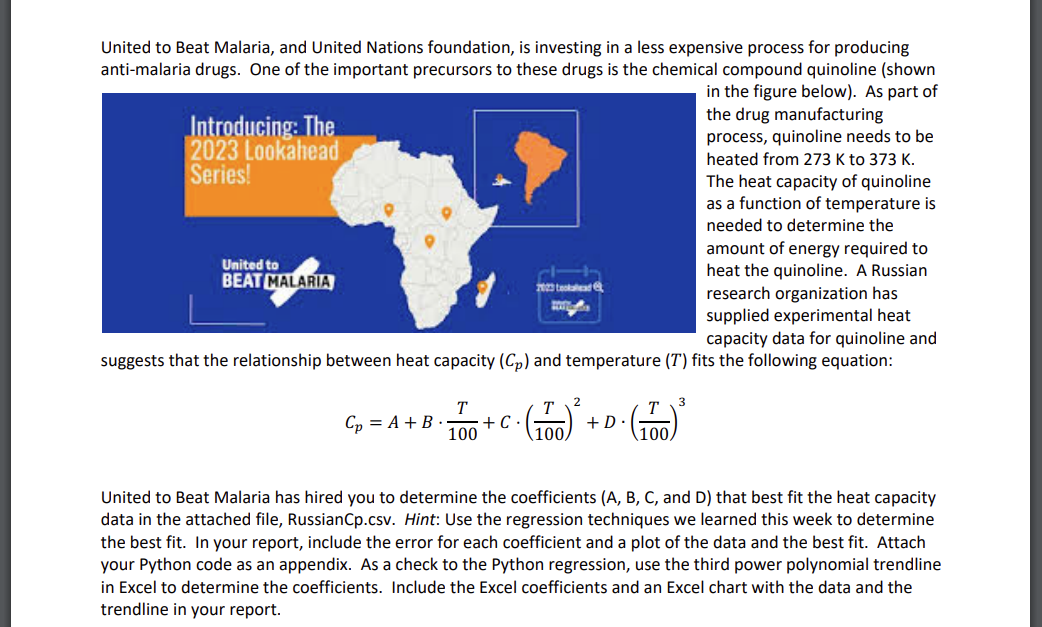
United to Beat Malaria, and United Nations foundation, is investing in a less expensive process for producing anti-malaria drugs. One of the important precursors to these drugs is the chemical compound quinoline (shown the figure below). As part of Ie drug manufacturing ocess, quinoline needs to be zated from 273K to 373K. e heat capacity of quinoline ; a function of temperature is zeded to determine the nount of energy required to zat the quinoline. A Russian search organization has spplied experimental heat upacity data for quinoline and suggests that the relationship between heat capacity (Cp) and temperature (T) fits the following equation: Cp=A+B100T+C(100T)2+D(100T)3 United to Beat Malaria has hired you to determine the coefficients (A, B, C, and D) that best fit the heat capacity data in the attached file, RussianCp.csv. Hint: Use the regression techniques we learned this week to determine the best fit. In your report, include the error for each coefficient and a plot of the data and the best fit. Attach your Python code as an appendix. As a check to the Python regression, use the third power polynomial trendline in Excel to determine the coefficients. Include the Excel coefficients and an Excel chart with the data and the trendline in your reportStep by Step Solution
There are 3 Steps involved in it
Step: 1

Get Instant Access to Expert-Tailored Solutions
See step-by-step solutions with expert insights and AI powered tools for academic success
Step: 2

Step: 3

Ace Your Homework with AI
Get the answers you need in no time with our AI-driven, step-by-step assistance
Get Started


