Question
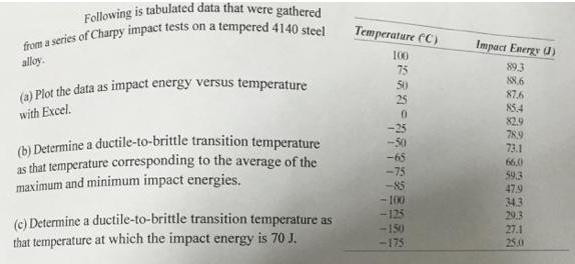
(a) Plot the data as impact energy versus temperature Following is tabulated data that were gathered on Temperature (C) Impact Energy U) 100 75

(a) Plot the data as impact energy versus temperature Following is tabulated data that were gathered on Temperature (C) Impact Energy U) 100 75 50 25 alloy. 893 S8.6 87.6 854 82.9 789 with Excel. (b) Determine a ductile-to-brittle transition temperature as that temperature corresponding to the average of the maximum and minimum impact energies. -50 73.1 66,0 59.3 47.9 -75 -85 - 100 -125 -150 343 29.3 (c) Determine a ductile-to-brittle transition temperature as that temperature at which the impact energy is 70 J. 27.1 25.1 -175
Step by Step Solution
There are 3 Steps involved in it
Step: 1
a The plot of Impact energy vs Temperature is shown below b The average of maxi...
Get Instant Access to Expert-Tailored Solutions
See step-by-step solutions with expert insights and AI powered tools for academic success
Step: 2

Step: 3

Ace Your Homework with AI
Get the answers you need in no time with our AI-driven, step-by-step assistance
Get StartedRecommended Textbook for
Materials Science and Engineering An Introduction
Authors: William D. Callister Jr., David G. Rethwisch
8th edition
470419970, 978-0470419977
Students also viewed these Physics questions
Question
Answered: 1 week ago
Question
Answered: 1 week ago
Question
Answered: 1 week ago
Question
Answered: 1 week ago
Question
Answered: 1 week ago
Question
Answered: 1 week ago
Question
Answered: 1 week ago
Question
Answered: 1 week ago
Question
Answered: 1 week ago
Question
Answered: 1 week ago
Question
Answered: 1 week ago
Question
Answered: 1 week ago
Question
Answered: 1 week ago
Question
Answered: 1 week ago
Question
Answered: 1 week ago
Question
Answered: 1 week ago
Question
Answered: 1 week ago
Question
Answered: 1 week ago
Question
Answered: 1 week ago
View Answer in SolutionInn App


