

Question: Temperature Distribution. The temperature distribution in a thin metal plate with constant (or isothermal) temperatures on each side can be modeled using a two-dimensional
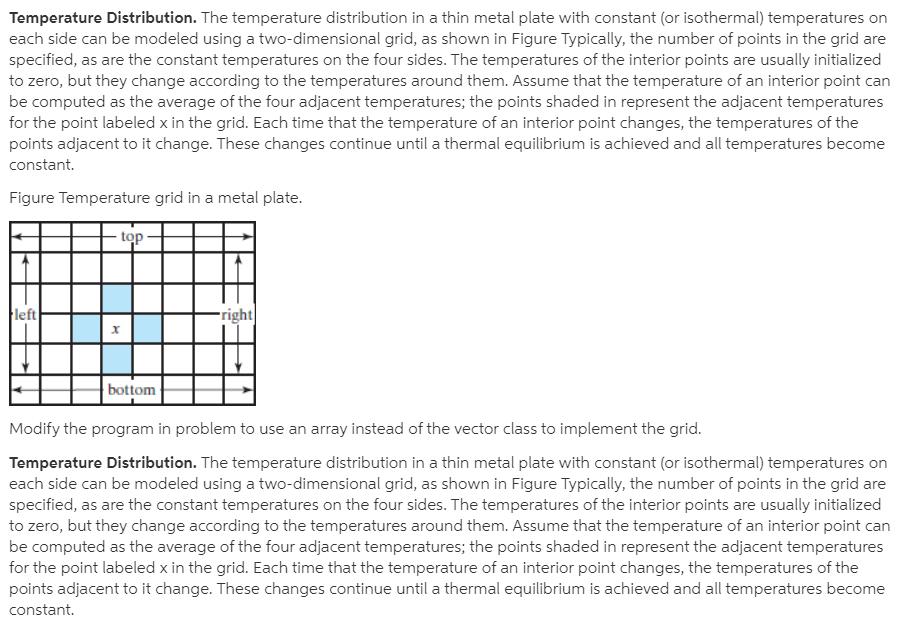
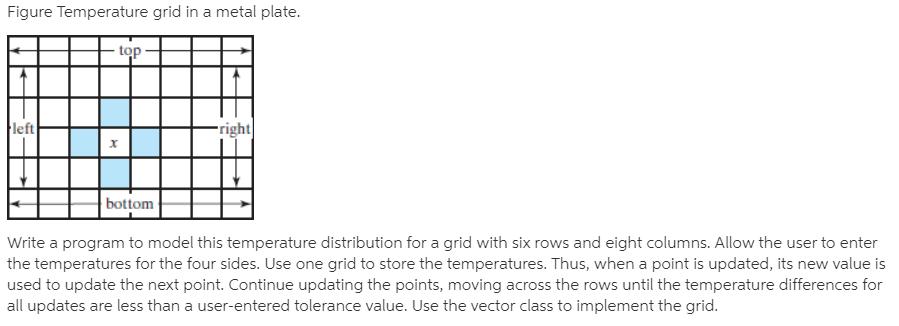
Temperature Distribution. The temperature distribution in a thin metal plate with constant (or isothermal) temperatures on each side can be modeled using a two-dimensional grid, as shown in Figure Typically, the number of points in the grid are specified, as are the constant temperatures on the four sides. The temperatures of the interior points are usually initialized to zero, but they change according to the temperatures around them. Assume that the temperature of an interior point can be computed as the average of the four adjacent temperatures; the points shaded in represent the adjacent temperatures for the point labeled x in the grid. Each time that the temperature of an interior point changes, the temperatures of the points adjacent to it change. These changes continue until a thermal equilibrium is achieved and all temperatures become constant. Figure Temperature grid in a metal plate. top Fleft -right| bottom- Modify the program in problem to use an array instead of the vector class to implement the grid. Temperature Distribution. The temperature distribution in a thin metal plate with constant (or isothermal) temperatures on each side can be modeled using a two-dimensional grid, as shown in Figure Typically, the number of points in the grid are specified, as are the constant temperatures on the four sides. The temperatures of the interior points are usually initialized to zero, but they change according to the temperatures around them. Assume that the temperature of an interior point can be computed as the average of the four adjacent temperatures; the points shaded in represent the adjacent temperatures for the point labeled x in the grid. Each time that the temperature of an interior point changes, the temperatures of the points adjacent to it change. These changes continue until a thermal equilibrium is achieved and all temperatures become constant. Figure Temperature grid in a metal plate. top- -right| Fleft bottom Write a program to model this temperature distribution for a grid with six rows and eight columns. Allow the user to enter the temperatures for the four sides. Use one grid to store the temperatures. Thus, when a point is updated, its new value is used to update the next point. Continue updating the points, moving across the rows until the temperature differences for all updates are less than a user-entered tolerance value. Use the vector class to implement the grid.
Step by Step Solution
3.32 Rating (140 Votes )
There are 3 Steps involved in it
Sure lets modify the program to use an array instead of the vector class to implement the grid for the temperature distribution problem We need to mod... View full answer

Get step-by-step solutions from verified subject matter experts