

Question
C++ please! Background In this lab you will compute the steady state temperature distribution over a piece of metal. This steady state analysis is used
C++ please!
Background
In this lab you will compute the steady state temperature distribution over a piece of metal. This steady state analysis is used in solving many physics problems. Similar matrix algorithms are also used in analyzing airplane wing and automobile surface pressure. These types of calculations are intended to ensure that everything works correctly in such applications. Though the full analysis may be complicated, pieces of it are quite simple, such as the problem described below.
Part 1 - Initialize and Print 2D Array
In this lab you will write a program to determine the temperature distribution for a two-dimensional plate with constant boundary conditions. Use a 10 X 10 two-dimensional array of numbers to represent the temperature at different places on a (square) plate. The elements on the boundaries have fixed temperatures. The elements on the top and bottom row have a fixed temperature of 100 degrees. The elements on the leftmost and rightmost columns have a fixed temperature of 0 degrees. (The corner elements have a temperature of 0 degrees.) Also assume that all interior elements start at 0 degrees. This obviously does not represent a typical hot plate, but this is a good exercise to simulate how temperature would dynamically distribute across a surface.
For part one you must initialize the 2D array and print it to the screen. Print the numbers in the array with a fixed precision of 3 and width 9. The first auto-grade tests all whitespace to make sure you have exact spacing, etc. on this first test. Note that there is one comma (just a comma) after each number, except the last number in the row. For example, an initialized 5 X 5 matrix (note: yours will be 10 X 10) would look like this.
0.000, 100.000, 100.000, 100.000, 0.000 0.000, 0.000, 0.000, 0.000, 0.000 0.000, 0.000, 0.000, 0.000, 0.000 0.000, 0.000, 0.000, 0.000, 0.000 0.000, 100.000, 100.000, 100.000, 0.000
You must initialize the plate programmatically using loops. You may not use a large number of assignment statements. You must also use a 2-d array, not a vector nor a large number of independent variables.
Before Part 2
Figure out by hand what the values of array cells [1][0], [1][1], [1][2], [2][1], and [2][2] will be for the first and second iterations on a 10 X 10 (not including the initial values). This will give you the opportunity to think through how the updates should be done and make sure you are correct on a few cells after a couple iterations. Place your calculated results in the Canvas submission quiz and the TAs will check them for correctness. To calculate the new temperature value of an array element, take the average of the temperatures of the four neighbors of that cell from the previous iteration. The next section describes in more detail how the update process should work.
Part 2 - Update Elements Once
The task of the algorithm is to find the steady-state temperature distribution of the interior elements which are constantly changing to become the average of the temperature of their neighbors. Steady state means that the temperature of any cell is virtually unchanging and approximately equal to the average of the temperatures of its four neighbors on the north, south, east, and west directions (do not worry about the diagonal neighbors). Note that the steady state temperatures will be the same regardless of what the beginning temperatures are for the interior elements.
To calculate the new temperature value of an array element, take the average of the temperatures of the four neighbors of that cell from the previous iteration. This value will be placed in the new array. For example, suppose the current state of the plate is (it won't be like this to start out with, but suppose it were):
0.000, 100.000, 100.000, 100.000, 0.000 0.000, 40.625, 50.000, 40.625, 0.000 0.000, 25.000, 31.250, 25.000, 0.000 0.000, 40.625, 50.000, 40.625, 0.000 0.000, 100.000, 100.000, 100.000, 0.000
In this example, the cell at position array[1][3] currently has a value of 40.625 degrees. At the current iteration, this element in the new array will be set to the average of the current value of its four neighbors, that is, (array[0][3] + array[1][4] + array[2][3] + array[1][2])/4 or (100.000 + 0.000 + 25.000 + 50.000)/4 which is 43.750.
Remember, the outermost rows and columns of your hotplate will have fixed temperatures of 100 and 0 degrees, respectively (with the corners having a fixed temperature of 0 degrees).
For Part 2, just print the first iteration. (Note that the first iteration is NOT the initialized matrix, it is the matrix obtained after one update to each cell in the array).
If you think about it you will realize that the value at array[2][3] depends upon the value at array[1][3]. One could ask, should the computation of array[2][3] use the value of array[1][3] as it was at the start of the current iteration, or the already updated value. This is an interesting theoretical question, but for our purposes you need to use the value as it was at the start of the iteration. Thus you will need two 2D arrays, one of which should contain the values as they were before the computations (an "old values" array), and one where the new values are being placed (a "new values" array).
Part 3 - Repeat Update until Steady State is Achieved
After printing the results from the first iteration, continue to iterate (calculating the temperature for all interior cells) until no cell in the array changes by more than 0.1 degrees. Your program should monitor the largest change for any cell in the array in order to determine when to stop iterating. At the end of each iteration you will copy the values from the "new values" array into the "old values" array, to be ready for the next iteration.
Once all of the values in the plate have ceased to change by more than 0.1 degrees, print the final values of the steady state plate, in the same comma separated form used above. Do not print all the intermediate arrays, just the final one after it reaches steady state.
Part 4 - Write Data to a File
Write the values of the steady state plate, with the same comma separated format, to a file named "Hotplate.csv". Your program should create/open the file, write to it, and then close it. With CLion, the file will appear in your default directory which is the same directory where your source code resides. Thus you just need to open "Hotplate.csv" with no preceding directory path. In CLion you can open the file with notepad to make sure it is correct. In zyBooks a file will also be created in your default folder but it will be created on the remote server where your code is being run. Thus, you will not have access to it. However, the zyBook auto-grader will access the file "Hotplate.csv" that you create and populate, and make sure it matches a correct copy which we supply in the test case.
Part 5 - Input Plate
Input into your plate array from the file "Inputplate.txt" which you should have in the same directory as "Hotplate.csv" in CLion. For zyBooks we have already uploaded a file "Inputplate.txt" which you can open and read from. Fill ALL elements of your array from this file including the borders, (though the borders will continue to have the same static values as before). After inputting the initial array, iterate just 3 times with your plate update loop, and then print the current plate values to the screen. These will be the array values after exactly 3 update iterations. You may assume that the input file has only doubles and correctly matches the 10 X 10 array, thus you will not need to error check your file input. Note that regardless of initial temperatures in the interior, if you have the same constant edge temperatures, and if you run until the plate reaches steady state, this plate would have the same steady state values (within .1 degrees) as the steady state plate above. You might want to try it. Download the contents of the input file here and put a copy in your CLion Hot Plate directory with the name "Inputplate.txt". For a guide on how to correctly put the "Inputplate.txt" file into your directory, see the last bullet point in the FAQ.
Part 6 - Use Excel to Graph the Results
Use Excel to open the "Hotplate.csv" file that you wrote with CLion in part 4. Select all the data in the file, then do "Insert", then "RecommededChart", then "All Charts" tab, then "Surface". This should add a nice surface plot of the steady state values into your excel workbook. We hope this gives you a warm feeling (it's a hotplate!). Since we cannot auto-grade this part, to get the points you need to a) have successfully completed part 4 (with zyBook auto-grade), b) then in the Canvas submission quiz there is a question which will let you state whether you have successfully created the graph in excel using the file you created and populated with your program running in CLion. Canvas will then add the points to your lab grade.
Special Requirements:
- You must adhere to the style guidelines. (up to 10 points)
- You must use 2 dimensional arrays of doubles (not vectors nor any other mechanism) to manage the plate values. (20 points)
- You must initialize the array using loops. (15 points)
- You must monitor the stopping criteria in the loop structure and stop when no cell in the array changes by more than 0.1 degrees. (10 points)
Notes
- Make sure you properly set fixed, precision and width for both cout and your file stream, and we suggest that you use constants for these parameters.
- You must use all of the values in the array to determine if it is time to stop iterating in part 3 (for example, you may not just check one value).
- Note that if you wanted to simulate a 30 X 30 plate (or the 5 X 5 plate below), you should only need to change one constant, recompile, and it would work just fine. In fact, if it were me, I would probably start by doing a 5 X 5 version which is easy to see and debug, and then make the simple one constant change to 10 X 10 after that is working. As usual we have provided sample output below, but it is output from a smaller 5 X 5 plate. If you correctly used a constant for the size of the plate, you should be able to easily run your code at 5 X 5 and compare your output to the output given below. Also, to help you debug, in the 10 X 10 plate, the final value at plate[3][2] (the cell in the 4th row and 3rd column) is 38.189. After the 3rd iteration of the input plate (Part 5), the value at plate[3][2] is -4.766.
- The output is wide and thus a little hard to read. Running your code in CLion gives you more room to see the output but eventually you will have to run it in zyBooks for submission. If you are having trouble seeing the output in zyBooks, you can select in the results box and move your mouse to the right or use the arrow keys (depending on your browser). You can also copy your results from the results box and paste them into notepad, wordpad, textedit or some other editor so that you can more easily see the data.Some of the zyBook auto-grade tests do not show the entire output.
- Some of the values will remain hidden.
file "Inputplate.txt" (This is what the file contained)
0.0 100.0 100.0 100.0 100.0 100.0 100.0 100.0 100.0 0.0 0.0 0.0 0.0 0.0 -65.0 0.0 0.0 0.0 0.0 0.0 0.0 -2000.0 0.0 0.0 0.0 0.0 678.0 0.0 0.0 0.0 0.0 0.0 0.0 -45.0 0.0 0.0 0.0 0.0 -450.0 0.0 0.0 400.0 0.0 333.0 0.0 0.0 68.0 0.0 0.0 0.0 0.0 0.0 0.0 0.0 0.0 0.0 0.0 0.0 0.0 0.0 0.0 0.0 0.0 0.0 0.0 0.0 0.0 0.0 0.0 0.0 0.0 12.12 0.0 45.8 0.0 -222.0 0.0 0.0 700.0 0.0 0.0 -50.0 0.0 0.0 0.0 0.0 0.0 0.0 0.0 0.0 0.0 100.0 100.0 100.0 100.0 100.0 100.0 100.0 100.0 0.0
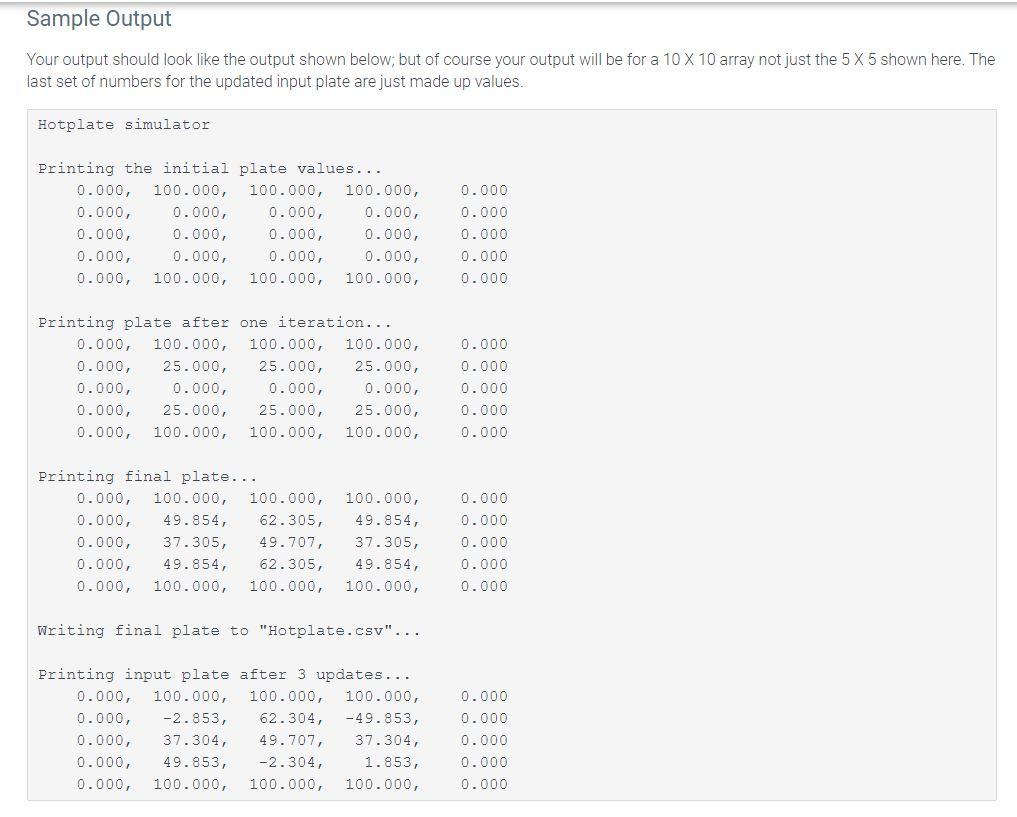
Sample Output Your output should look like the output shown below; but of course your output will be for a 10 X 10 array not just the 5 X 5 shown here. The last set of numbers for the updated input plate are just made values. Hotplate simulator Printing the initial plate values... 0.000, 100.000, 100.000, 100.000, 0.000, 0.000, 0.000, 0.000, 0.000, 0.000, 0.000, 0.000, 0.000, 0.000, 0.000, 0.000, 0.000, 100.000, 100.000, 100.000, 0.000 0.000 0.000 0.000 0.000 Printing plate after one iteration... 0.000, 100.000, 100.000, 100.000, 0.000, 25.000, 25.000, 25.000, 0.000, 0.000, 0.000, 0.000, 0.000, 25.000, 25.000, 25.000, 0.000, 100.000, 100.000, 100.000, 0.000 0.000 0.000 0.000 0.000 Printing final plate... 0.000, 100.000, 100.000, 0.000, 49.854, 62.305, 0.000, 37.305, 49.707, 0.000, 49.854, 62.305, 0.000, 100.000, 100.000, 100.000, 49.854, 37.305, 49.854, 100.000, 0.000 0.000 0.000 0.000 0.000 Writing final plate to "Hotplate.csv"... Printing input plate after 3 updates... 0.000, 100.000, 100.000, 100.000, 0.000, -2.853, 62.304, -49.853, 0.000, 37.304, 49.707, 37.304, 0.000, 49.853, -2.304, 1.853, 0.000, 100.000, 100.000, 100.000, 0.000 0.000 0.000 0.000 0.000Step by Step Solution
There are 3 Steps involved in it
Step: 1

Get Instant Access to Expert-Tailored Solutions
See step-by-step solutions with expert insights and AI powered tools for academic success
Step: 2

Step: 3
Ace Your Homework with AI
Get the answers you need in no time with our AI-driven, step-by-step assistance
Get Started
Machine Learning And Knowledge Discovery In Databases European Conference Ecml Pkdd 2019 Wurzburg Germany September 16 20 2019 Proceedings Part 2 Lnai 11907
Authors: Ulf Brefeld ,Elisa Fromont ,Andreas Hotho ,Arno Knobbe ,Marloes Maathuis ,Celine Robardet
1st Edition