Template
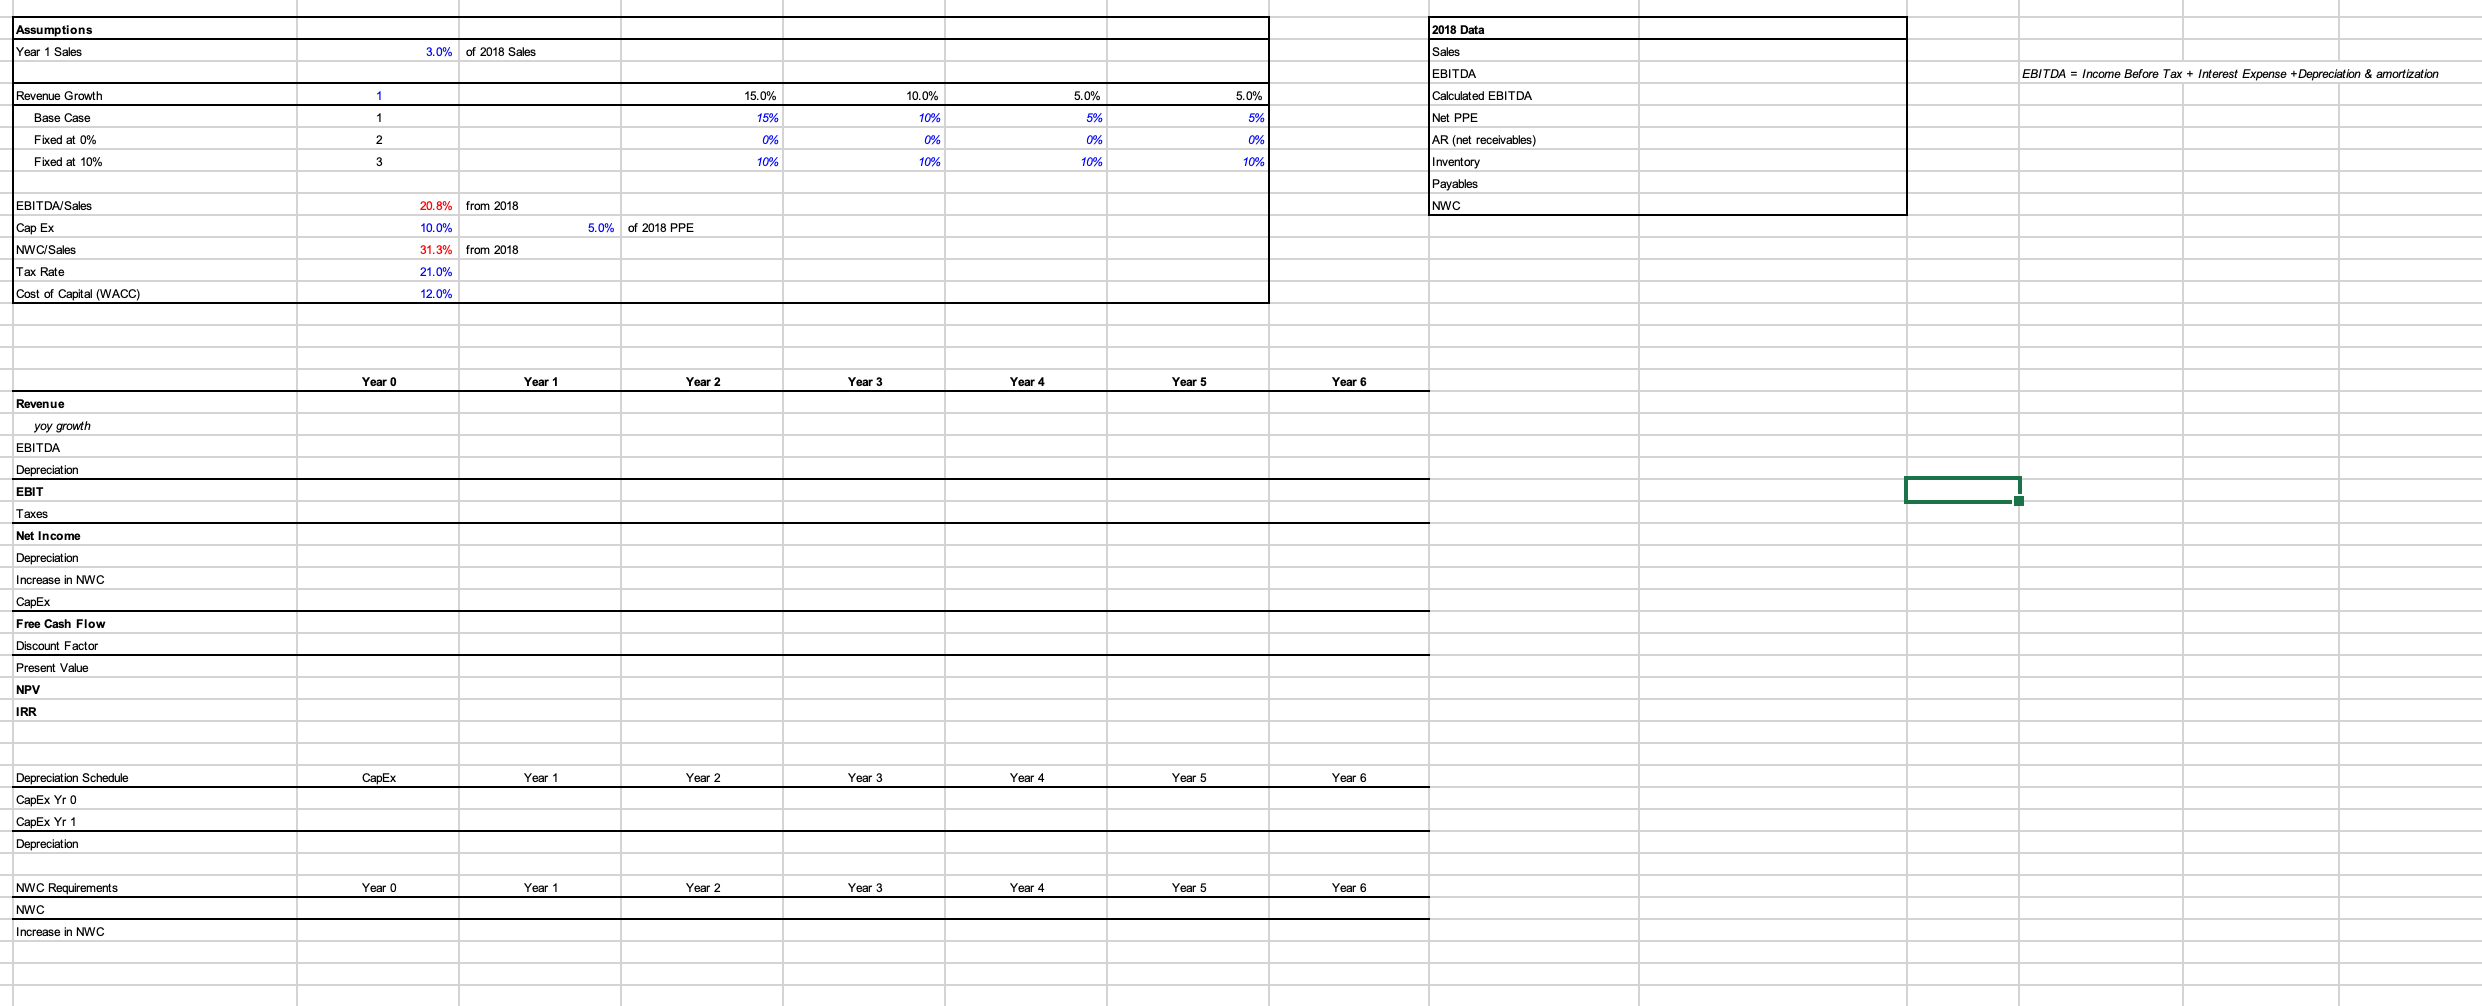
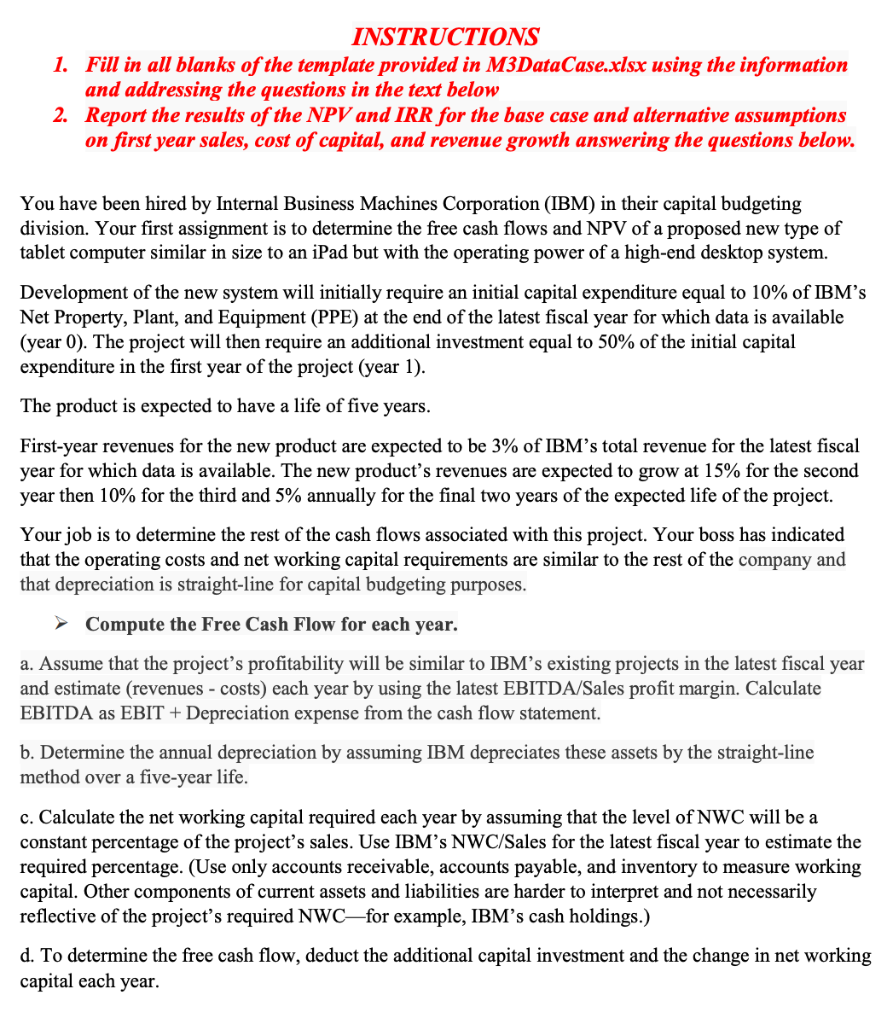
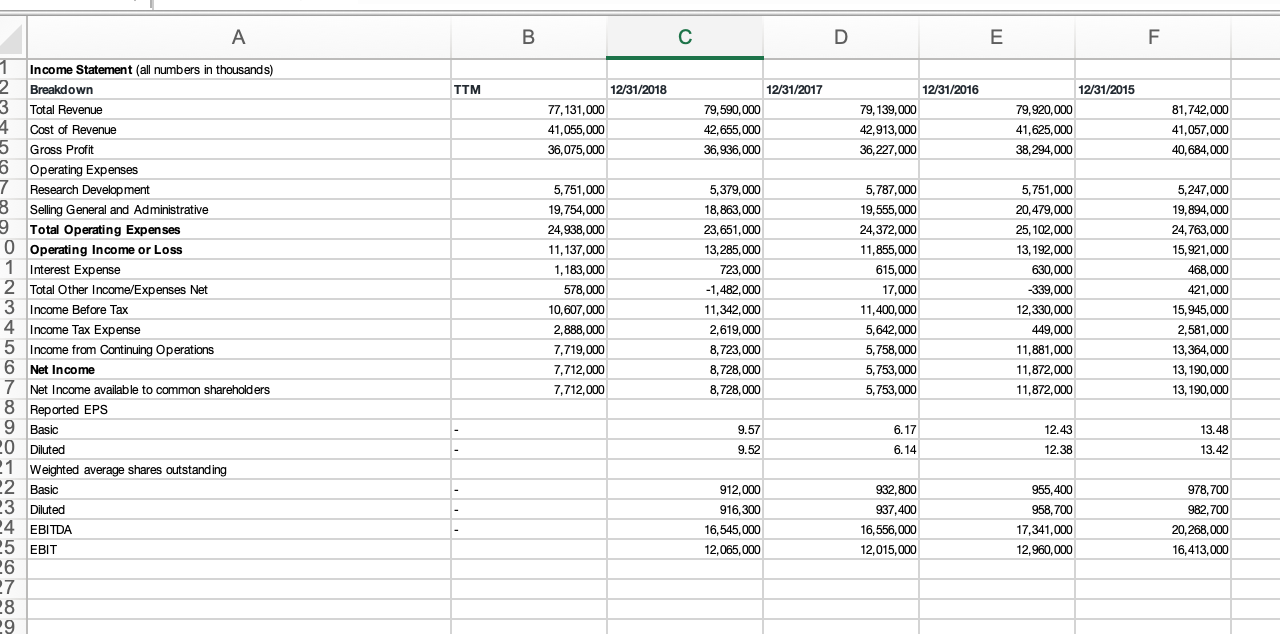
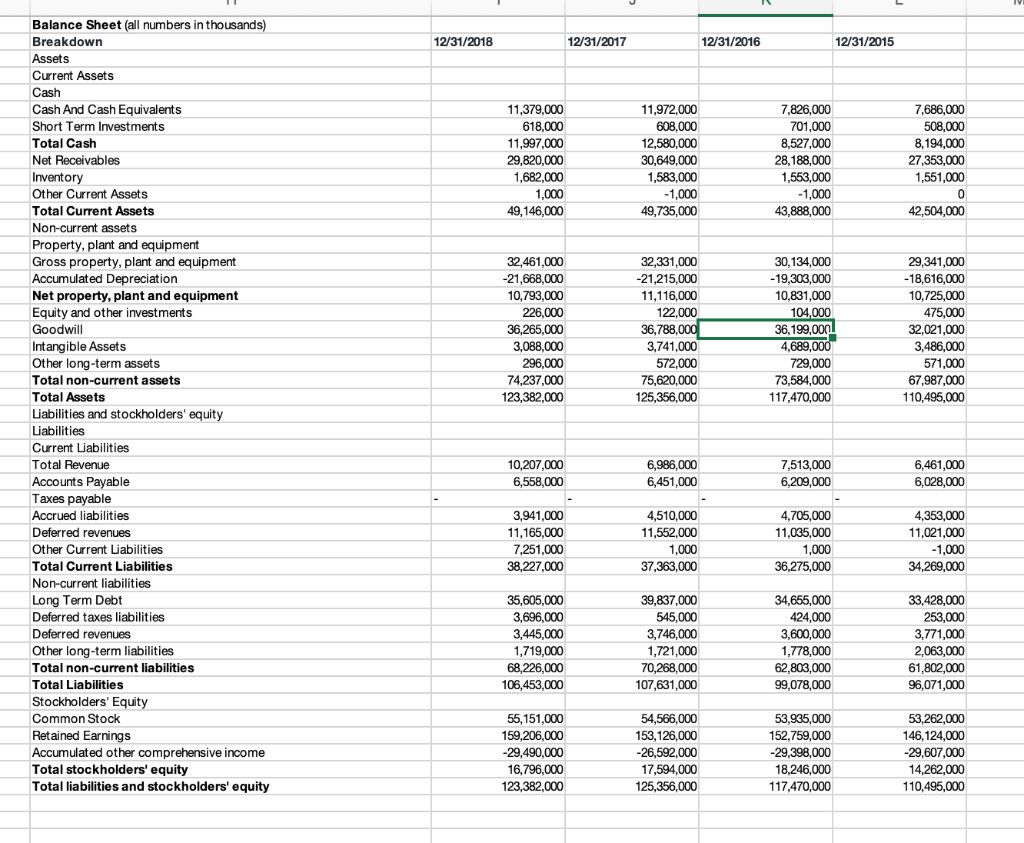
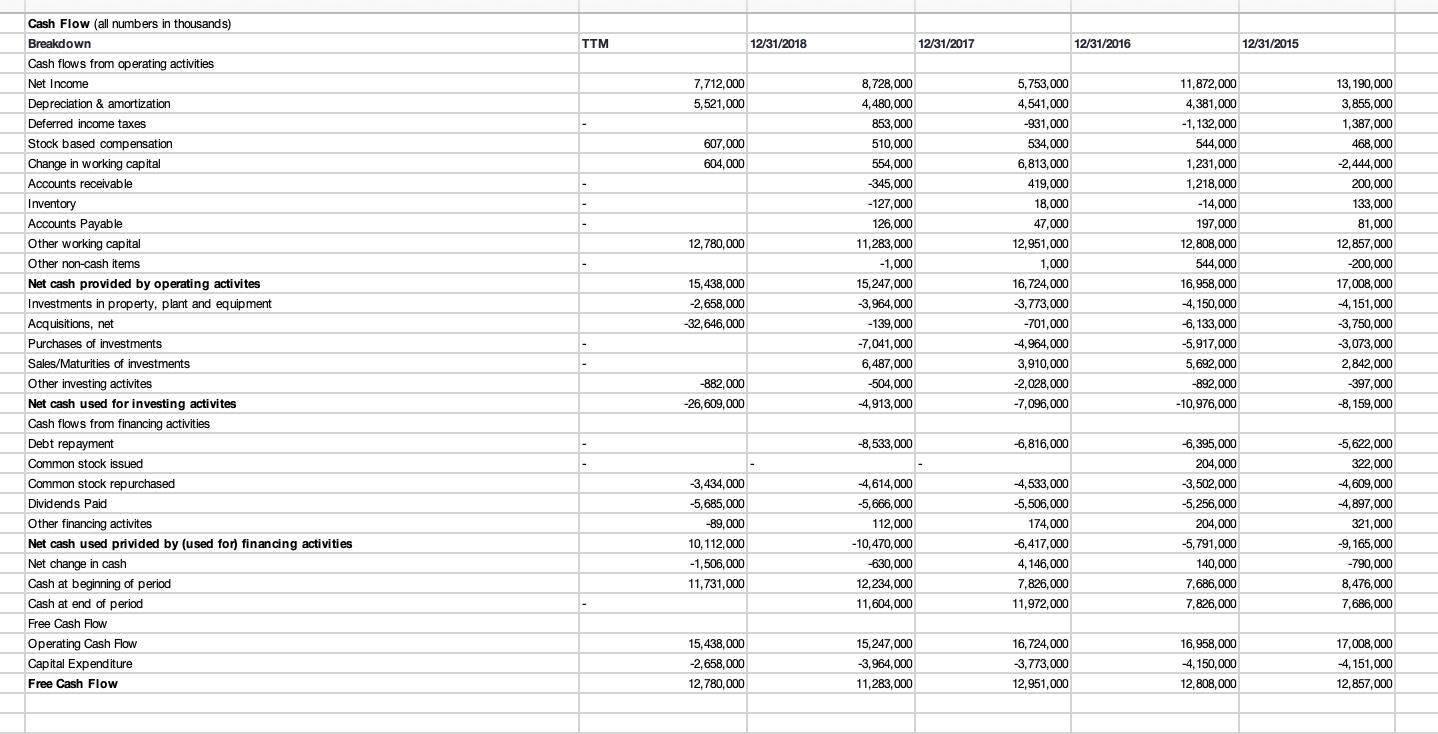
INSTRUCTIONS 1. Fill in all blanks of the template provided in M3DataCase.xlsx using the information and addressing the questions in the text below 2. Report the results of the NPV and IRR for the base case and alternative assumptions on first year sales, cost of capital, and revenue growth answering the questions below. You have been hired by Internal Business Machines Corporation (IBM) in their capital budgeting division. Your first assignment is to determine the free cash flows and NPV of a proposed new type of tablet computer similar in size to an iPad but with the operating power of a high-end desktop system. Development of the new system will initially require an initial capital expenditure equal to 10% of IBM's Net Property, Plant, and Equipment (PPE) at the end of the latest fiscal year for which data is available (year 0). The project will then require an additional investment equal to 50% of the initial capital expenditure in the first year of the project (year 1). The product is expected to have a life of five years. First-year revenues for the new product are expected to be 3% of IBM's total revenue for the latest fiscal year for which data is available. The new product's revenues are expected to grow at 15% for the second year then 10% for the third and 5% annually for the final two years of the expected life of the project. Your job is to determine the rest of the cash flows associated with this project. Your boss has indicated that the operating costs and net working capital requirements are similar to the rest of the company and that depreciation is straight-line for capital budgeting purposes. > Compute the Free Cash Flow for each year. a. Assume that the project's profitability will be similar to IBM's existing projects in the latest fiscal year and estimate (revenues - costs) each year by using the latest EBITDA/Sales profit margin. Calculate EBITDA as EBIT + Depreciation expense from the cash flow statement. b. Determine the annual depreciation by assuming IBM depreciates these assets by the straight-line method over a five-year life. c. Calculate the net working capital required each year by assuming that the level of NWC will be a constant percentage of the project's sales. Use IBM's NWC/Sales for the latest fiscal year to estimate the required percentage. (Use only accounts receivable, accounts payable, and inventory to measure working capital. Other components of current assets and liabilities are harder to interpret and not necessarily reflective of the project's required NWCfor example, IBM's cash holdings.) d. To determine the free cash flow, deduct the additional capital investment and the change in net working capital each year. A B D E F TTM 12/31/2015 12/31/2018 77,131,000 41,055,000 36,075,000 12/31/2017 79,590,000 42,655,000 36,936,000 12/31/2016 79, 139,000 42,913,000 36, 227,000 79,920,000 41,625,000 38,294,000 81,742,000 41,057,000 40,684,000 5,379.000 18,863,000 1 Income Statement (all numbers in thousands) 2 Breakdown 3 Total Revenue 4 Cost of Revenue 5 Gross Profit 6 Operating Expenses 7 Research Development 8 Selling General and Administrative 9 Total Operating Expenses 0 Operating Income or Loss 1 Interest Expense 2 Total Other Income/Expenses Net 3 Income Before Tax 4 Income Tax Expense 5 Income from Continuing Operations 6 Net Income 7 Net Income available to common shareholders 8 Reported EPS 5,751,000 19,754,000 24,938,000 11, 137,000 1,183,000 578,000 10,607,000 2,888,000 7,719,000 7,712,000 7,712,000 23,651,000 13,285,000 723,000 -1,482,000 11.342.000 2,619,000 8,723,000 8,728,000 8,728,000 5,787,000 19,555,000 24,372,000 11,855,000 615,000 17,000 11,400,000 5,642,000 5,758,000 5,753,000 5,753,000 5,751,000 20,479,000 25, 102,000 13, 192,000 630,000 -339,000 12,330.000 449,000 11,881,000 11,872,000 11,872,000 5,247,000 19,894,000 24,763,000 15,921,000 468,000 421,000 15,945,000 2,581,000 13,364,000 13,190,000 13,190,000 9.57 6.17 13.48 9 Basic 20 Diluted 12.43 12.38 9.52 6.14 13.42 1 Weighted average shares outstanding -2 Basic 23 Diluted 932,800 24 EBITDA 25 EBIT 912,000 916,300 16,545,000 12,065,000 937,400 16,556,000 12,015,000 955,400 958,700 17,341,000 12,960,000 978,700 982,700 20,268,000 16,413,000 6 27 8 9 OOOO 12/31/2018 12/31/2017 12/31/2016 12/31/2015 11,379,000 618,000 11,997,000 29,820,000 1,682,000 1,000 49,146,000 11,972,000 608,000 12,580,000 30,649,000 1,583,000 -1,000 49,735,000 7.826,000 701,000 8,527,000 28,188,000 1,553,000 -1,000 43,888,000 7,686,000 508,000 8,194,000 27,353,000 1,551,000 0 0 42,504,000 32,461,000 -21,668,000 10,793,000 226,000 36,265,000 3,088,000 296,000 74,237,000 123,382,000 32,331,000 -21,215,000 11,116,000 122,000 36,788,000 3,741,000 572,000 75,620.000 125,356,000 30,134,000 -19,303,000 10,831,000 104,000 36,199,000 4,689,000 729.000 73,584,000 117,470.000 29,341,000 -18,616,000 10,725,000 475,000 32,021,000 3,486,000 571,000 67,987,000 110,495,000 Balance Sheet (all numbers in thousands) Breakdown Assets Current Assets Cash Cash And Cash Equivalents Short Term Investments Total Cash Net Receivables Inventory Other Current Assets Total Current Assets Non-current assets Property, plant and equipment Gross property, plant and equipment Accumulated Depreciation Net property, plant and equipment Equity and other investments Goodwill Intangible Assets Other long-term assets Total non-current assets Total Assets Liabilities and stockholders' equity Liabilities Current Liabilities Total Revenue Accounts Payable Taxes payable Accrued liabilities Deferred revenues Other Current Liabilities Total Current Liabilities Non-current liabilities Long Term Debt Deferred taxes liabilities Deferred revenues Other long-term liabilities Total non-current liabilities Total Liabilities Stockholders' Equity Common Stock Retained Earnings Accumulated other comprehensive income Total stockholders' equity Total liabilities and stockholders' equity 10,207,000 6,558,000 6,986,000 6,451,000 7,513,000 6,209,000 6,461,000 6,028,000 3,941,000 11,165,000 7,251,000 38,227,000 4,510,000 11,552,000 1,000 37,363,000 4,705,000 11,035,000 1.000 36.275,000 4,353,000 11,021,000 -1,000 34,269,000 35,605,000 3,696,000 3,445.000 1,719,000 68,226,000 106,453,000 39,837,000 545,000 3,746,000 1,721,000 70,268,000 107,631,000 34,655,000 424,000 3,600,000 1,778,000 62,803,000 99,078,000 33,428,000 253,000 3,771,000 2,063,000 61,802,000 96,071,000 55,151,000 159,206,000 -29,490,000 16,796,000 123,382,000 54,566,000 153, 126,000 -26,592,000 17,594,000 125,356,000 53,935,000 152,759,000 -29,398,000 18,246,000 117,470,000 53,262,000 146, 124,000 -29,607,000 14,262,000 110,495,000 TTM 12/31/2018 12/31/2017 12/31/2016 12/31/2015 7.712,000 5,521,000 607,000 604,000 8,728,000 4,480,000 853,000 510,000 554,000 -345,000 -127,000 126,000 12,780,000 Cash Flow (all numbers in thousands) Breakdown Cash flows from operating activities Net Income Depreciation & amortization Deferred income taxes Stock based compensation Change in working capital Accounts receivable Inventory Accounts Payable Other working capital Other non-cash items Net cash provided by operating activites Investments in property, plant and equipment Acquisitions, net Purchases of investments Sales/Maturities of investments Other investing activites Net cash used for investing activites Cash flows from financing activities Debt repayment Common stock issued Common stock repurchased Dividends Paid Other financing activites Net cash used privided by (used for) financing activities Net change in cash Cash at beginning of period Cash at end of period Free Cash Flow Operating Cash Flow Capital Expenditure Free Cash Flow 5,753,000 4,541,000 -931,000 534,000 6,813,000 419,000 18,000 47,000 12,951,000 1,000 16,724,000 3,773,000 -701,000 -4,964,000 3,910,000 -2,028,000 -7,096,000 11,283,000 -1,000 15, 247,000 -3,964,000 -139,000 -7,041,000 6,487,000 -504.000 11,872,000 4,381,000 -1, 132,000 544,000 1,231,000 1,218,000 -14,000 197,000 12,808,000 544,000 16,958,000 4,150,000 -6,133,000 -5,917,000 5,692,000 -892,000 -10,976,000 15,438,000 -2,658,000 -32,646,000 13,190,000 3,855,000 1,387,000 468,000 -2,444,000 200,000 133,000 81,000 12,857,000 -200,000 17,008,000 4,151,000 3,750,000 -3,073,000 2,842,000 -397,000 -8, 159,000 -882,000 -26,609,000 -4,913,000 -8,533,000 6,816,000 -3,434,000 -5,685,000 -89,000 10,112,000 -1,506,000 11,731,000 4,614,000 -5,666,000 112,000 -10,470.000 -630,000 12,234,000 11,604,000 -4,533,000 -5,506,000 174,000 -6,417,000 4,146,000 7,826,000 11,972,000 -6,395,000 204,000 -3,502,000 -5,256,000 204,000 -5,791,000 140,000 7,686,000 7,826,000 -5,622,000 322,000 -4,609,000 -4,897,000 321,000 -9, 165,000 -790,000 8,476,000 7,686,000 15,438,000 -2,658,000 12,780,000 15, 247,000 -3,964,000 11,283,000 16,724,000 3,773,000 12,951,000 16,958,000 -4,150,000 12,808,000 17,008,000 -4, 151,000 12,857,000 2018 Data Assumptions Year 1 Sales 3.0% of 2018 Sales Sales EBITDA EBITDA = Income Before Tax + Interest Expense + Depreciation & amortization 15.0% 5.0% Revenue Growth Base Case 10.0% 10% Calculated EBITDA Net PPE 1 15% 5.0% 5% 0% 5% 2 0% 0% 0% Fixed at 0% Fixed at 10% 3 10% 10% 10% 10% AR (net receivables) Inventory Payables NWC EBITDA/Sales 20.8% from 2018 Cap Ex 10.0% 5.0% of 2018 PPE NWC/Sales Tax Rate 31.3% from 2018 21.0% 12.0% Cost of Capital (WACC) Year 0 Year 1 Year 2 Year 3 Year 4 Year 5 Year 6 Revenue yoy growth EBITDA Depreciation EBIT Taxes Net Income Depreciation Increase in NWC CapEx Free Cash Flow Discount Factor Present Value NPV IRR Capex Year 1 Year 2 Year 3 Year 4 Year 5 Year 6 Depreciation Schedule CapEx Yr 0 CapEx Yr 1 Depreciation Year o Year 1 Year 2 Year 3 Year 4 Year 5 Year 6 NWC Requirements NWC Increase in NWC INSTRUCTIONS 1. Fill in all blanks of the template provided in M3DataCase.xlsx using the information and addressing the questions in the text below 2. Report the results of the NPV and IRR for the base case and alternative assumptions on first year sales, cost of capital, and revenue growth answering the questions below. You have been hired by Internal Business Machines Corporation (IBM) in their capital budgeting division. Your first assignment is to determine the free cash flows and NPV of a proposed new type of tablet computer similar in size to an iPad but with the operating power of a high-end desktop system. Development of the new system will initially require an initial capital expenditure equal to 10% of IBM's Net Property, Plant, and Equipment (PPE) at the end of the latest fiscal year for which data is available (year 0). The project will then require an additional investment equal to 50% of the initial capital expenditure in the first year of the project (year 1). The product is expected to have a life of five years. First-year revenues for the new product are expected to be 3% of IBM's total revenue for the latest fiscal year for which data is available. The new product's revenues are expected to grow at 15% for the second year then 10% for the third and 5% annually for the final two years of the expected life of the project. Your job is to determine the rest of the cash flows associated with this project. Your boss has indicated that the operating costs and net working capital requirements are similar to the rest of the company and that depreciation is straight-line for capital budgeting purposes. > Compute the Free Cash Flow for each year. a. Assume that the project's profitability will be similar to IBM's existing projects in the latest fiscal year and estimate (revenues - costs) each year by using the latest EBITDA/Sales profit margin. Calculate EBITDA as EBIT + Depreciation expense from the cash flow statement. b. Determine the annual depreciation by assuming IBM depreciates these assets by the straight-line method over a five-year life. c. Calculate the net working capital required each year by assuming that the level of NWC will be a constant percentage of the project's sales. Use IBM's NWC/Sales for the latest fiscal year to estimate the required percentage. (Use only accounts receivable, accounts payable, and inventory to measure working capital. Other components of current assets and liabilities are harder to interpret and not necessarily reflective of the project's required NWCfor example, IBM's cash holdings.) d. To determine the free cash flow, deduct the additional capital investment and the change in net working capital each year. A B D E F TTM 12/31/2015 12/31/2018 77,131,000 41,055,000 36,075,000 12/31/2017 79,590,000 42,655,000 36,936,000 12/31/2016 79, 139,000 42,913,000 36, 227,000 79,920,000 41,625,000 38,294,000 81,742,000 41,057,000 40,684,000 5,379.000 18,863,000 1 Income Statement (all numbers in thousands) 2 Breakdown 3 Total Revenue 4 Cost of Revenue 5 Gross Profit 6 Operating Expenses 7 Research Development 8 Selling General and Administrative 9 Total Operating Expenses 0 Operating Income or Loss 1 Interest Expense 2 Total Other Income/Expenses Net 3 Income Before Tax 4 Income Tax Expense 5 Income from Continuing Operations 6 Net Income 7 Net Income available to common shareholders 8 Reported EPS 5,751,000 19,754,000 24,938,000 11, 137,000 1,183,000 578,000 10,607,000 2,888,000 7,719,000 7,712,000 7,712,000 23,651,000 13,285,000 723,000 -1,482,000 11.342.000 2,619,000 8,723,000 8,728,000 8,728,000 5,787,000 19,555,000 24,372,000 11,855,000 615,000 17,000 11,400,000 5,642,000 5,758,000 5,753,000 5,753,000 5,751,000 20,479,000 25, 102,000 13, 192,000 630,000 -339,000 12,330.000 449,000 11,881,000 11,872,000 11,872,000 5,247,000 19,894,000 24,763,000 15,921,000 468,000 421,000 15,945,000 2,581,000 13,364,000 13,190,000 13,190,000 9.57 6.17 13.48 9 Basic 20 Diluted 12.43 12.38 9.52 6.14 13.42 1 Weighted average shares outstanding -2 Basic 23 Diluted 932,800 24 EBITDA 25 EBIT 912,000 916,300 16,545,000 12,065,000 937,400 16,556,000 12,015,000 955,400 958,700 17,341,000 12,960,000 978,700 982,700 20,268,000 16,413,000 6 27 8 9 OOOO 12/31/2018 12/31/2017 12/31/2016 12/31/2015 11,379,000 618,000 11,997,000 29,820,000 1,682,000 1,000 49,146,000 11,972,000 608,000 12,580,000 30,649,000 1,583,000 -1,000 49,735,000 7.826,000 701,000 8,527,000 28,188,000 1,553,000 -1,000 43,888,000 7,686,000 508,000 8,194,000 27,353,000 1,551,000 0 0 42,504,000 32,461,000 -21,668,000 10,793,000 226,000 36,265,000 3,088,000 296,000 74,237,000 123,382,000 32,331,000 -21,215,000 11,116,000 122,000 36,788,000 3,741,000 572,000 75,620.000 125,356,000 30,134,000 -19,303,000 10,831,000 104,000 36,199,000 4,689,000 729.000 73,584,000 117,470.000 29,341,000 -18,616,000 10,725,000 475,000 32,021,000 3,486,000 571,000 67,987,000 110,495,000 Balance Sheet (all numbers in thousands) Breakdown Assets Current Assets Cash Cash And Cash Equivalents Short Term Investments Total Cash Net Receivables Inventory Other Current Assets Total Current Assets Non-current assets Property, plant and equipment Gross property, plant and equipment Accumulated Depreciation Net property, plant and equipment Equity and other investments Goodwill Intangible Assets Other long-term assets Total non-current assets Total Assets Liabilities and stockholders' equity Liabilities Current Liabilities Total Revenue Accounts Payable Taxes payable Accrued liabilities Deferred revenues Other Current Liabilities Total Current Liabilities Non-current liabilities Long Term Debt Deferred taxes liabilities Deferred revenues Other long-term liabilities Total non-current liabilities Total Liabilities Stockholders' Equity Common Stock Retained Earnings Accumulated other comprehensive income Total stockholders' equity Total liabilities and stockholders' equity 10,207,000 6,558,000 6,986,000 6,451,000 7,513,000 6,209,000 6,461,000 6,028,000 3,941,000 11,165,000 7,251,000 38,227,000 4,510,000 11,552,000 1,000 37,363,000 4,705,000 11,035,000 1.000 36.275,000 4,353,000 11,021,000 -1,000 34,269,000 35,605,000 3,696,000 3,445.000 1,719,000 68,226,000 106,453,000 39,837,000 545,000 3,746,000 1,721,000 70,268,000 107,631,000 34,655,000 424,000 3,600,000 1,778,000 62,803,000 99,078,000 33,428,000 253,000 3,771,000 2,063,000 61,802,000 96,071,000 55,151,000 159,206,000 -29,490,000 16,796,000 123,382,000 54,566,000 153, 126,000 -26,592,000 17,594,000 125,356,000 53,935,000 152,759,000 -29,398,000 18,246,000 117,470,000 53,262,000 146, 124,000 -29,607,000 14,262,000 110,495,000 TTM 12/31/2018 12/31/2017 12/31/2016 12/31/2015 7.712,000 5,521,000 607,000 604,000 8,728,000 4,480,000 853,000 510,000 554,000 -345,000 -127,000 126,000 12,780,000 Cash Flow (all numbers in thousands) Breakdown Cash flows from operating activities Net Income Depreciation & amortization Deferred income taxes Stock based compensation Change in working capital Accounts receivable Inventory Accounts Payable Other working capital Other non-cash items Net cash provided by operating activites Investments in property, plant and equipment Acquisitions, net Purchases of investments Sales/Maturities of investments Other investing activites Net cash used for investing activites Cash flows from financing activities Debt repayment Common stock issued Common stock repurchased Dividends Paid Other financing activites Net cash used privided by (used for) financing activities Net change in cash Cash at beginning of period Cash at end of period Free Cash Flow Operating Cash Flow Capital Expenditure Free Cash Flow 5,753,000 4,541,000 -931,000 534,000 6,813,000 419,000 18,000 47,000 12,951,000 1,000 16,724,000 3,773,000 -701,000 -4,964,000 3,910,000 -2,028,000 -7,096,000 11,283,000 -1,000 15, 247,000 -3,964,000 -139,000 -7,041,000 6,487,000 -504.000 11,872,000 4,381,000 -1, 132,000 544,000 1,231,000 1,218,000 -14,000 197,000 12,808,000 544,000 16,958,000 4,150,000 -6,133,000 -5,917,000 5,692,000 -892,000 -10,976,000 15,438,000 -2,658,000 -32,646,000 13,190,000 3,855,000 1,387,000 468,000 -2,444,000 200,000 133,000 81,000 12,857,000 -200,000 17,008,000 4,151,000 3,750,000 -3,073,000 2,842,000 -397,000 -8, 159,000 -882,000 -26,609,000 -4,913,000 -8,533,000 6,816,000 -3,434,000 -5,685,000 -89,000 10,112,000 -1,506,000 11,731,000 4,614,000 -5,666,000 112,000 -10,470.000 -630,000 12,234,000 11,604,000 -4,533,000 -5,506,000 174,000 -6,417,000 4,146,000 7,826,000 11,972,000 -6,395,000 204,000 -3,502,000 -5,256,000 204,000 -5,791,000 140,000 7,686,000 7,826,000 -5,622,000 322,000 -4,609,000 -4,897,000 321,000 -9, 165,000 -790,000 8,476,000 7,686,000 15,438,000 -2,658,000 12,780,000 15, 247,000 -3,964,000 11,283,000 16,724,000 3,773,000 12,951,000 16,958,000 -4,150,000 12,808,000 17,008,000 -4, 151,000 12,857,000 2018 Data Assumptions Year 1 Sales 3.0% of 2018 Sales Sales EBITDA EBITDA = Income Before Tax + Interest Expense + Depreciation & amortization 15.0% 5.0% Revenue Growth Base Case 10.0% 10% Calculated EBITDA Net PPE 1 15% 5.0% 5% 0% 5% 2 0% 0% 0% Fixed at 0% Fixed at 10% 3 10% 10% 10% 10% AR (net receivables) Inventory Payables NWC EBITDA/Sales 20.8% from 2018 Cap Ex 10.0% 5.0% of 2018 PPE NWC/Sales Tax Rate 31.3% from 2018 21.0% 12.0% Cost of Capital (WACC) Year 0 Year 1 Year 2 Year 3 Year 4 Year 5 Year 6 Revenue yoy growth EBITDA Depreciation EBIT Taxes Net Income Depreciation Increase in NWC CapEx Free Cash Flow Discount Factor Present Value NPV IRR Capex Year 1 Year 2 Year 3 Year 4 Year 5 Year 6 Depreciation Schedule CapEx Yr 0 CapEx Yr 1 Depreciation Year o Year 1 Year 2 Year 3 Year 4 Year 5 Year 6 NWC Requirements NWC Increase in NWC