Answered step by step
Verified Expert Solution
Link Copied!

Question

1 Approved Answer

Ten college sprinters participated in a test of the effect of a diet supplement on running speed. Data summarized in the following table indicate the
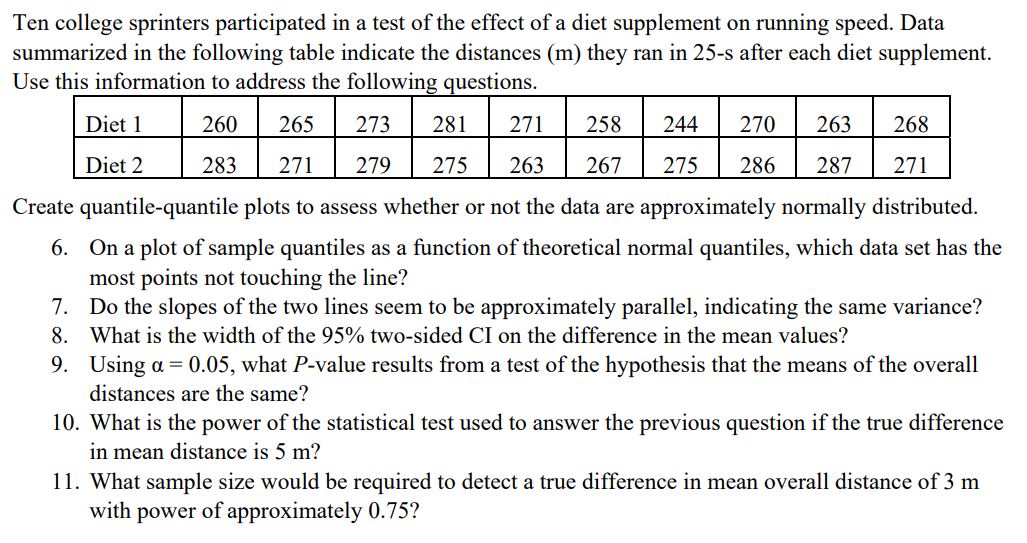
image text in transcribed
Ten college sprinters participated in a test of the effect of a diet supplement on running speed. Data summarized in the following table indicate the distances (m) they ran in 25-s after each diet supplement. Use this information to address the following questions. Create quantile-quantile plots to assess whether or not the data are approximately normally distributed. 6. On a plot of sample quantiles as a function of theoretical normal quantiles, which data set has the most points not touching the line? 7. Do the slopes of the two lines seem to be approximately parallel, indicating the same variance? What is the width of the 95% two-sided CI on the difference in the mean values? 9. Using a. = 0.05, what P-value results 'om a test of the hypothesis that the means of the overall distances are the same? 10. What is the power of the statistical test used to answer the previous question if the true difference in mean distance is 5 m? 11. What sample size wouid be required to detect a true difference in mean overall distance of 3 m with power of approximately 0.75? 9'\

Step by Step Solution

There are 3 Steps involved in it

Step: 1

blur-text-image

Get Instant Access to Expert-Tailored Solutions

See step-by-step solutions with expert insights and AI powered tools for academic success

Step: 2

blur-text-image_2

Step: 3

blur-text-image_3

Ace Your Homework with AI

Get the answers you need in no time with our AI-driven, step-by-step assistance

Get Started

Recommended Textbook for

Precalculus, Enhanced

Authors: Cynthia Y Young

3rd Edition

1119339510, 9781119339519

More Books

Students also viewed these Mathematics questions