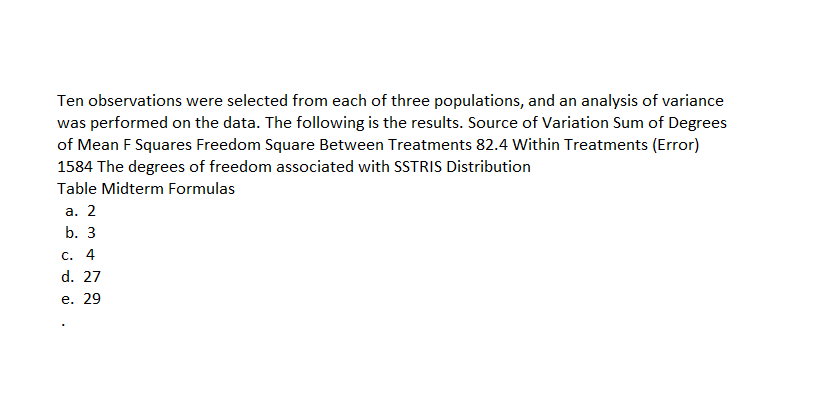
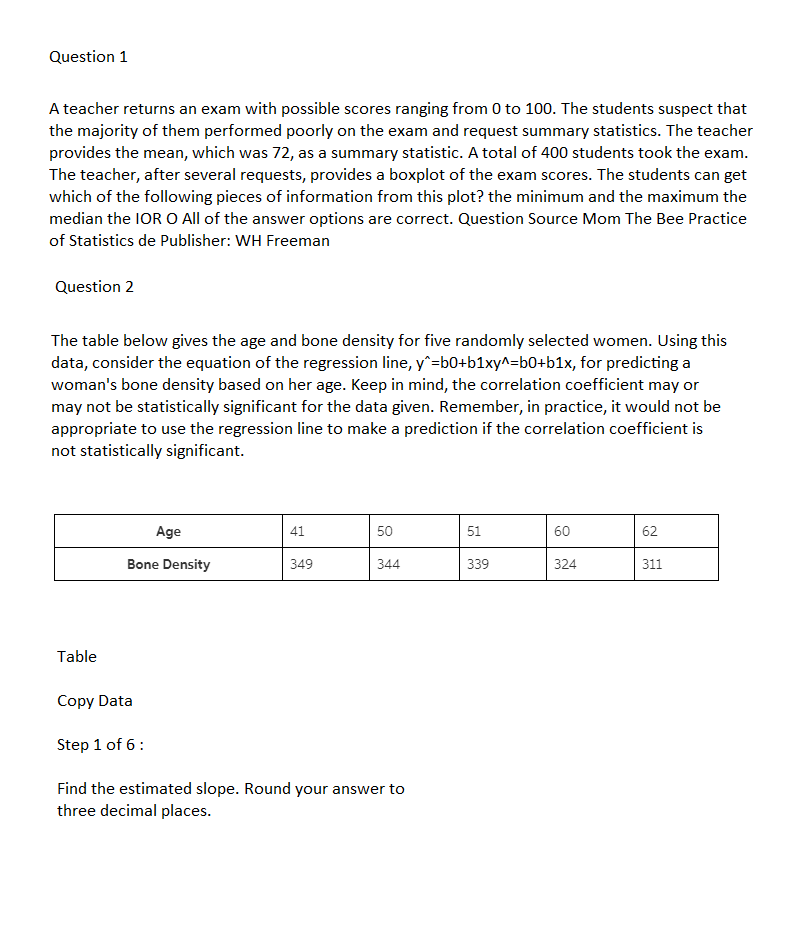
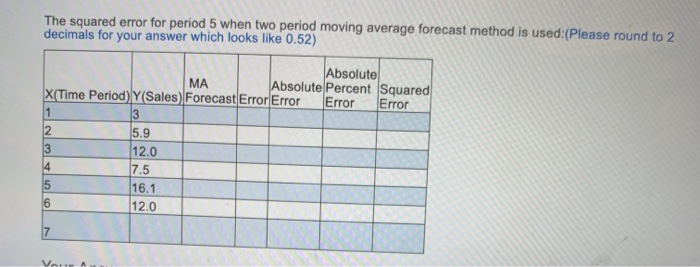
Ten observations were selected from each of three populations, and an analysis of variance was performed on the data. The following is the results. Source of Variation Sum of Degrees of Mean F Squares Freedom Square Between Treatments 82.4 Within Treatments {Error} 1584 The degrees of freedom associated with SSTRIS Distribution Table Midterm Formulas a. 2 b. 3 c. 4 d. 27 e. 29 Question 1 A teacher returns an exam with possible scores ranging from D to 100. The students suspect that the majority of them performed poorly on the exam and request summary statistics. The teacher provides the mean, which was 72, as a summary statistic. A total of 400 students took the exam. The teacher, after several requests, provides a boxplot of the exam scores. The students can get which of the following pieces of information from this plot? the minimum and the maximum the median the ICE 0 All of the answer options are correct. Question Source Mom The Bee Practice of Statistics de Publisher: WH Freeman Question 2 The table below gives the age and bone density for five randomly selected women. Using this data, consider the equation of the regression line, y"=bD+b1xy-"=b[)+b1x, for predicting a woman's bone density based on her age. Keep in mind, the correlation coefficient may or may not be statistically significant for the data given. Remember, in practice, it would not be appropriate to use the regression line to make a prediction if the correlation coefficient is not statistically significant. Age Bone De nsity Table Copy Data Step1 of 6: Find the estimated slope. Round your answer to three decimal places. The company has an agreement with a bank that allows the company to borrowr in increments of $1,000 at the beginning of each month. The interest rate on these loans is 1% per month and for simplicity we will assume that interest is not compounded. At the end of the quarter, the company would pay the bank all of the accumulated interest on the loan and as much of the loan as possible (in increments of $1,000}, while still retaining at least $55,000 in cash. Prepare a master budget for the threemonth period ending June 30. Include the following detailed budgets: Required Prepare a master budget for the threemonth period ending June 30. Include the following detailed budgets: 1. a. A sales budget, by month and in total b. A schedule of expected cash collections from sales, by month and in total. c. A merchandise purchases budget in units and in dollars. Show the budget by month and in total. d. A schedule of expected cash disbursements for merchandise purchases, by month and in total. 2. A cash budget. Show the budget by month and in total. The squared error for period 5 when two period moving average forecast method is used:(Please round to 2 decimals for your answer which looks like 0.52) Absolute MA Absolute Percent Squared X(Time Period) Y(Sales) Forecast Error Error Error Error 3 2 5.9 3 12.0 7.5 5 16.1 12.0Question The 95% confidence interval for the mean is obtained as follows: From the information, the mean residential electricity usage per household is 700 and the population standard deviation is 60 That is, A = 700 and o = 50 . Moreover, the mean electricity usage of 49 households is 715. That is, n = 49 and T = 715. Instructions to find the confidence interval for the mean is given below: 1.In EXCEL, Select Add-Ins > PHStat > Confidence Intervals > Estimate for the mean, Sigma known. 2 Enter 50 under Population standard deviation. 3.Enter 95 under Confidence Level. 4.In Input Options, choose Sample Statistic Known and enter 49 as the Sample size and 715 as the Sample mean. 5.In Output Options, enter a Title and click OK. Follow the above instructions to get the confidence interval in the output as shown below: Confidence Interval Estimate for the Mean Data Population Standard Deviation 50 Sample Mean 715 Sample Size 49 Confidence Level Intermediate Calculations Standard Error of the Mean 7.1429 Z Value .1.9600 Interval Half Width 13.9997 Confidence Interval Interval Lower Limit 701.00 Interval Upper Limit 729.00 From the output, the 95% confidence interval for the population mean is [701, 729] Thus, the 95% confidence interval for the population mean is [701, 729] . The null and alternative hypothesis stated as follows: Null hypothesis Ho : A = 700 Alternative hypothesis: H1 : A # 700 Explanation | Hint for next step The null hypothesis states that there is no evidence for the California power forecast is reasonable. The alternative hypothesis states that there is evidence for the California power forecast is reasonable.Question The p-value is obtained as follows: Instructions to find the p-value is given below: 1.In EXCEL, Select Add-Ins > PHStat > One-Sample Tests > t Test for the mean, Sigma known. 2 Enter 700 under Null hypothesis. 3.Enter 0.05 under Level of significance. 4.Enter 50 under population standard deviation. 5.In Sample Statistic Options, choose Sample Statistic Known and enter 49 as the Sample size and 715 as the Sample mean. 6.In Test Options, choose Two Tail Test. 7.click OK. Follow the above instructions to get the p-value in the output as shown below: Z Test of Hypothesis for the Mean Data Null Hypothesis 700 Level of Significance 0.05 Population Standard Deviation 50 Sample Size 49 Sample Mean 715 Intermediate Calculations Standard Error of the Mean 7.1429 Z Test Statistic 2.1000 Two-Tail Test Lower Critical Value 1.9600 Upper Critical Value 1.9600 p-Value 0.0357 Reject the null hypothesis From the output, the p-value is 0.0357. Thus, the p-value Is 0.0357. The conclusion is obtained as follows: Conclusion: Use the significance level, a = 0.05 The p-value is less than the level of significance. That is, p-value (= 0.0357)