Answered step by step
Verified Expert Solution
Question
1 Approved Answer
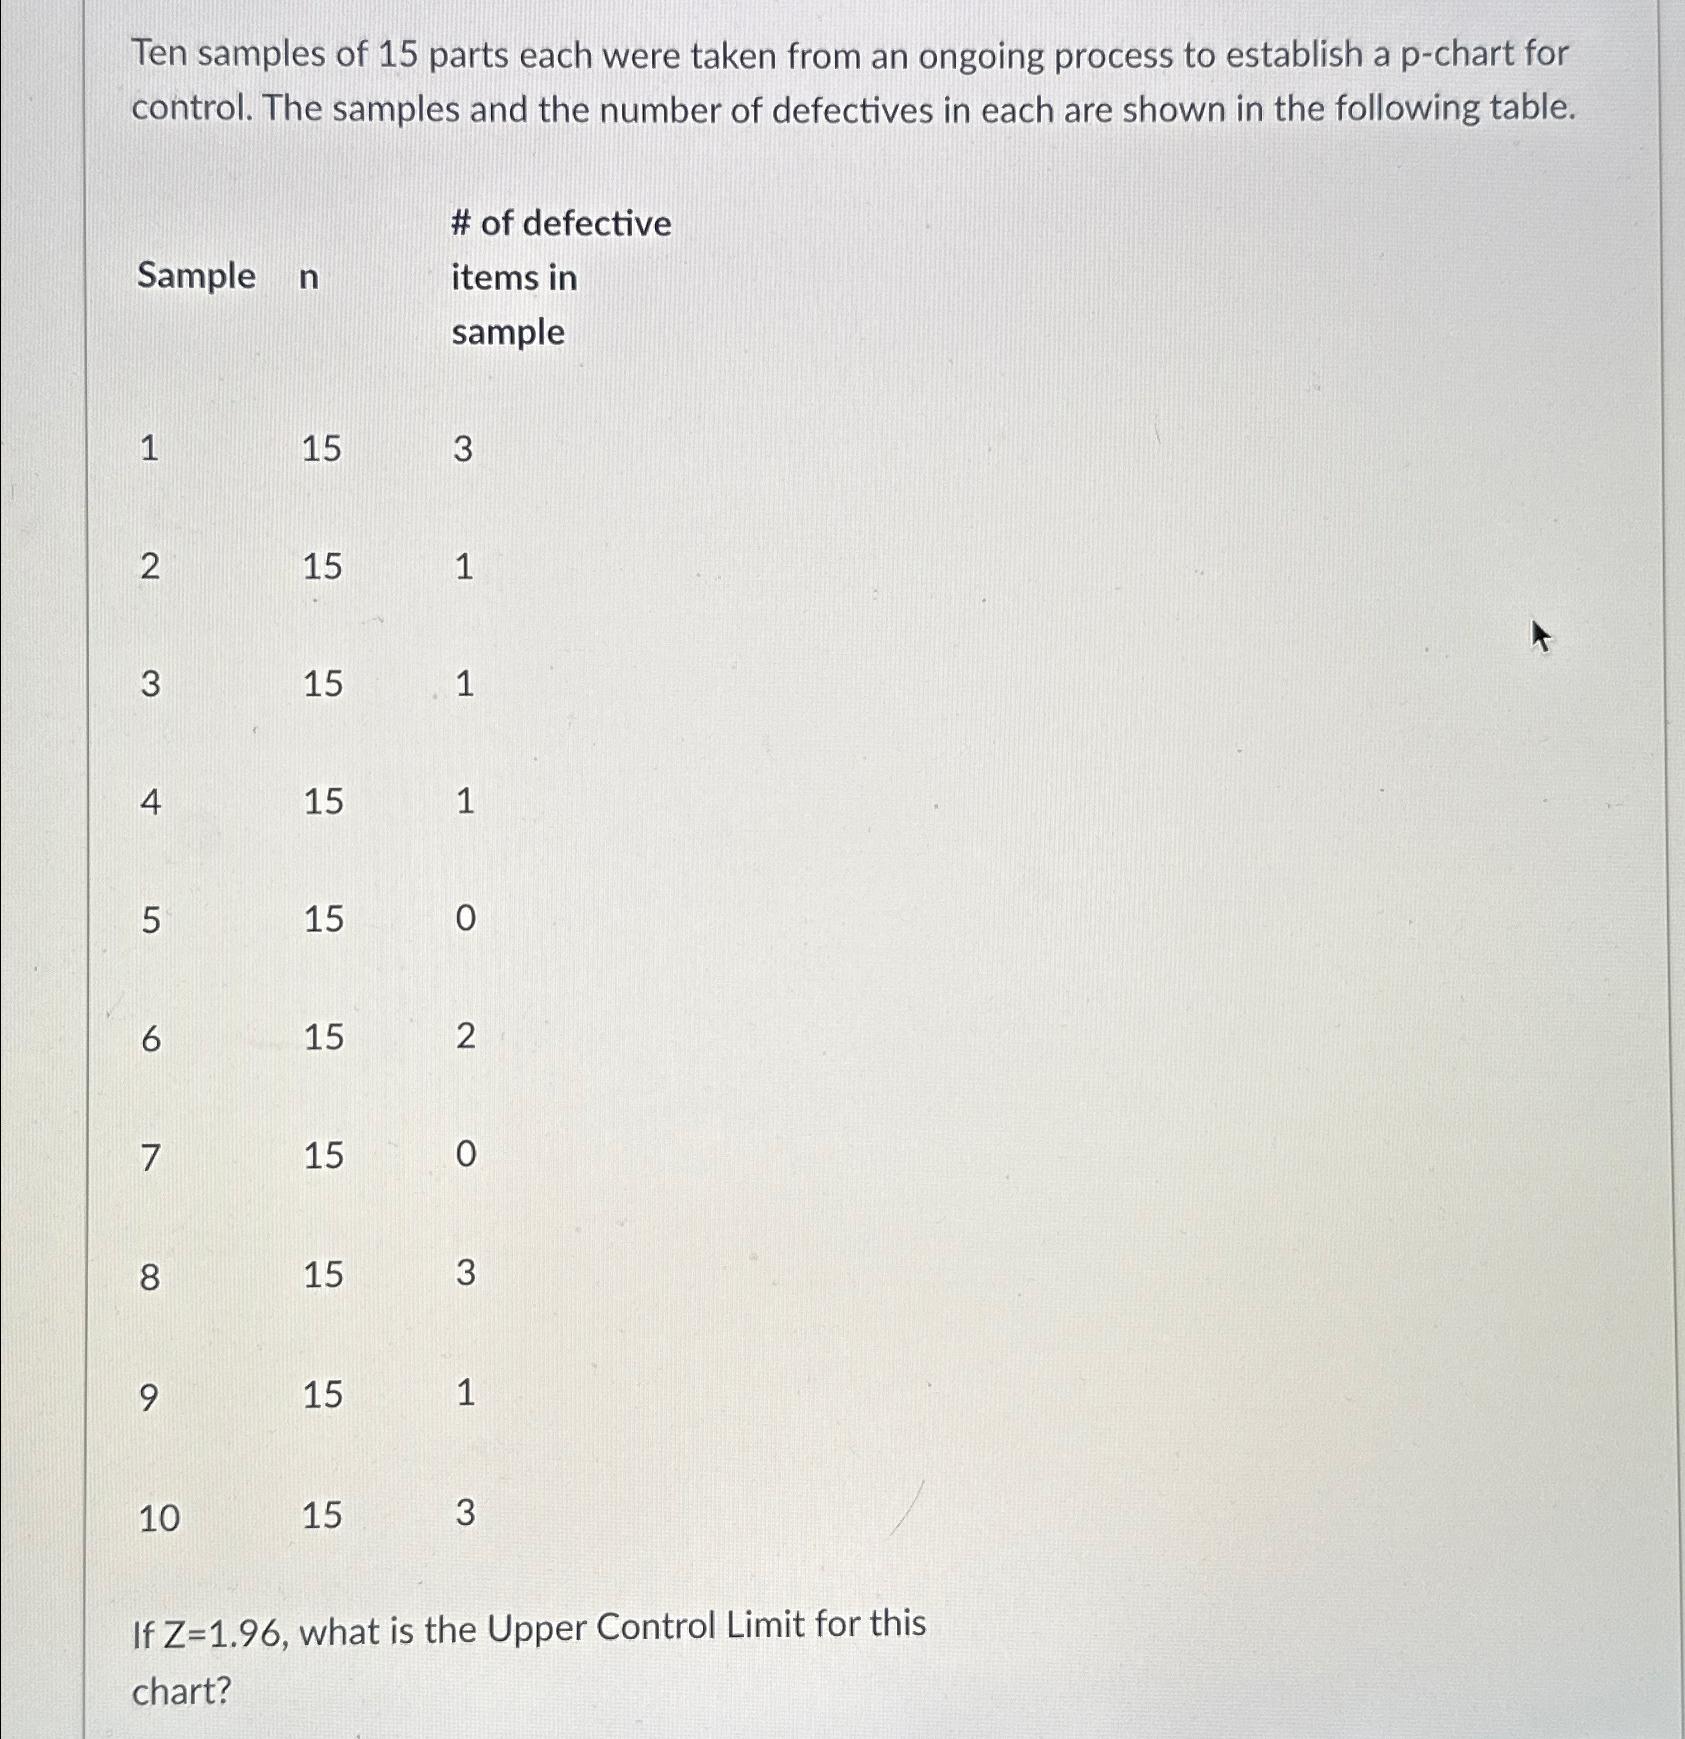
Ten samples of 1 5 parts each were taken from an ongoing process to establish a p - chart for control. The samples and the
Ten samples of parts each were taken from an ongoing process to establish a pchart for control. The samples and the number of defectives in each are shown in the following table.
tableSamplentable# of defectiveitems insample
If what is the Upper Control Limit for this chart?

Step by Step Solution
There are 3 Steps involved in it
Step: 1

Get Instant Access to Expert-Tailored Solutions
See step-by-step solutions with expert insights and AI powered tools for academic success
Step: 2

Step: 3

Ace Your Homework with AI
Get the answers you need in no time with our AI-driven, step-by-step assistance
Get Started


