Answered step by step
Verified Expert Solution
Link Copied!

Question

1 Approved Answer

Ten samples of 15 parts each were taken from an on going process to establish a p-chart for control. The samples and the number of
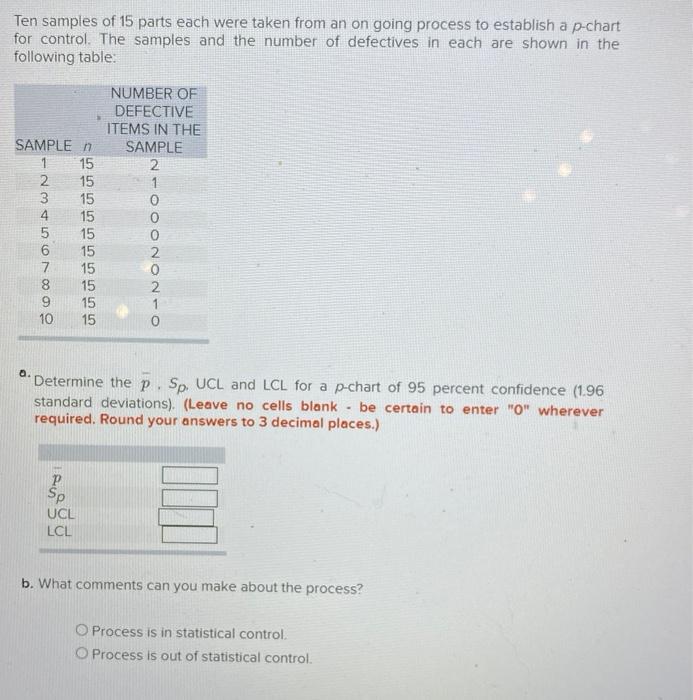
image text in transcribed
Ten samples of 15 parts each were taken from an on going process to establish a p-chart for control. The samples and the number of defectives in each are shown in the following table: 0. Determine the p,Sp. UCL and LCL for a p-chart of 95 percent confidence (1.96 standard deviations). (Leave no cells blank - be certain to enter " 0 " wherever required. Round your answers to 3 decimal places.) b. What comments can you make about the process? Process is in statistical control. Process is out of statistical control

Step by Step Solution

There are 3 Steps involved in it

Step: 1

blur-text-image

Get Instant Access to Expert-Tailored Solutions

See step-by-step solutions with expert insights and AI powered tools for academic success

Step: 2

blur-text-image

Step: 3

blur-text-image

Ace Your Homework with AI

Get the answers you need in no time with our AI-driven, step-by-step assistance

Get Started

Recommended Textbook for

Management Fundamentals

Authors: Robert N. Lussier

9th Edition

154438419X, 978-1544384191

More Books

Students also viewed these General Management questions

Question

Comment should this MNE have a global LGBT policy? Why/ why not?

Answered: 1 week ago