

Question
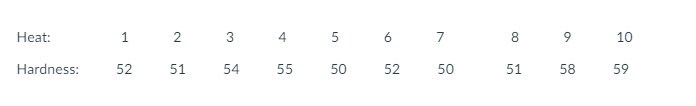
Ten successive heats of a steel alloy are tested for hardness. The resulting data are shown in the following table. Set up a control chart
Ten successive heats of a steel alloy are tested for hardness. The resulting data are shown in the following table. Set up a control chart for the moving range and a control chart for individual hardness measurements. ( only Control limits)
Step by Step Solution
There are 3 Steps involved in it
Step: 1

Get Instant Access to Expert-Tailored Solutions
See step-by-step solutions with expert insights and AI powered tools for academic success
Step: 2

Step: 3
Ace Your Homework with AI
Get the answers you need in no time with our AI-driven, step-by-step assistance
Get Started
Algebra And Trigonometry Enhanced With Graphing Utilities (Subscription)
Authors: Michael, Michael Sullivan III, Michael III Sullivan, Michael Sullivan 111, III Sullivan
6th Edition
0321849132, 9780321849137