

Answered step by step
Verified Expert Solution
Question
1 Approved Answer
term enrollment 1 2 2 1 3 0 4 4 5 10 6 3 7 9 8 8 9 0 10 9 11 10 12
| term | enrollment |
| 1 | 2 |
| 2 | 1 |
| 3 | 0 |
| 4 | 4 |
| 5 | 10 |
| 6 | 3 |
| 7 | 9 |
| 8 | 8 |
| 9 | 0 |
| 10 | 9 |
| 11 | 10 |
| 12 | 6 |
| 13 | 20 |
| 14 | 23 |
| 15 | 8 |
| 16 | 23 |
| 17 | 34 |
| 18 | 6 |
| 19 | 45 |
| 20 | 52 |
please use R
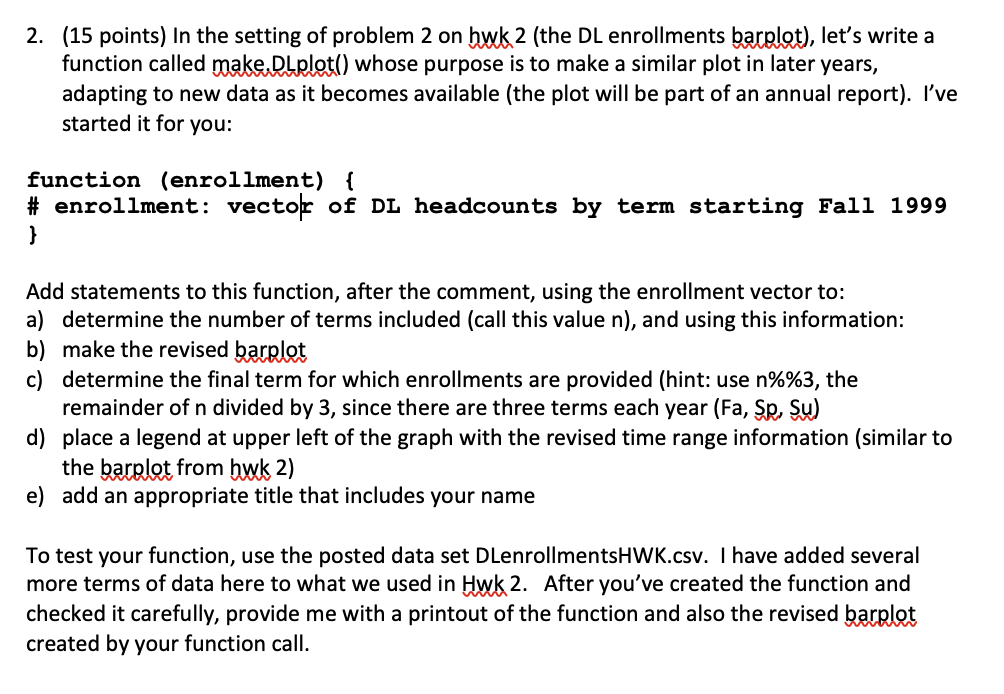
2. (15 points) In the setting of problem 2 on hwk 2 (the DL enrollments barplot), let's write a function called make.DLrlot() whose purpose is to make a similar plot in later years, adapting to new data as it becomes available (the plot will be part of an annual report). I've started it for you: function (enrollment) { # enrollment: vectoff of DL headcounts by term starting Fall 1999 } Add statements to this function, after the comment, using the enrollment vector to: a) determine the number of terms included (call this value n), and using this information: b) make the revised barplot c) determine the final term for which enrollments are provided (hint: use n%%3, the remainder of n divided by 3, since there are three terms each year (Fa, Sp, Su) d) place a legend at upper left of the graph with the revised time range information (similar to the barplot from hwk 2) e) add an appropriate title that includes your name To test your function, use the posted data set DLenrollmentsHWK.csv. I have added several more terms of data here to what we used in Hwk 2. After you've created the function and checked it carefully, provide me with a printout of the function and also the revised barplot created by your function call. 2. (15 points) In the setting of problem 2 on hwk 2 (the DL enrollments barplot), let's write a function called make.DLrlot() whose purpose is to make a similar plot in later years, adapting to new data as it becomes available (the plot will be part of an annual report). I've started it for you: function (enrollment) { # enrollment: vectoff of DL headcounts by term starting Fall 1999 } Add statements to this function, after the comment, using the enrollment vector to: a) determine the number of terms included (call this value n), and using this information: b) make the revised barplot c) determine the final term for which enrollments are provided (hint: use n%%3, the remainder of n divided by 3, since there are three terms each year (Fa, Sp, Su) d) place a legend at upper left of the graph with the revised time range information (similar to the barplot from hwk 2) e) add an appropriate title that includes your name To test your function, use the posted data set DLenrollmentsHWK.csv. I have added several more terms of data here to what we used in Hwk 2. After you've created the function and checked it carefully, provide me with a printout of the function and also the revised barplot created by your function callStep by Step Solution
There are 3 Steps involved in it
Step: 1

Get Instant Access to Expert-Tailored Solutions
See step-by-step solutions with expert insights and AI powered tools for academic success
Step: 2

Step: 3
Ace Your Homework with AI
Get the answers you need in no time with our AI-driven, step-by-step assistance
Get Started
Excel 2024 In 7 Days
Authors: Alan Dinkins
1st Edition
B0CJ3X98XK, 979-8861224000